Immigrants from Jordan vs Hmong Disability
COMPARE
Immigrants from Jordan
Hmong
Disability
Disability Comparison
Immigrants from Jordan
Hmong
11.1%
DISABILITY
99.3/ 100
METRIC RATING
79th/ 347
METRIC RANK
12.8%
DISABILITY
0.0/ 100
METRIC RATING
276th/ 347
METRIC RANK
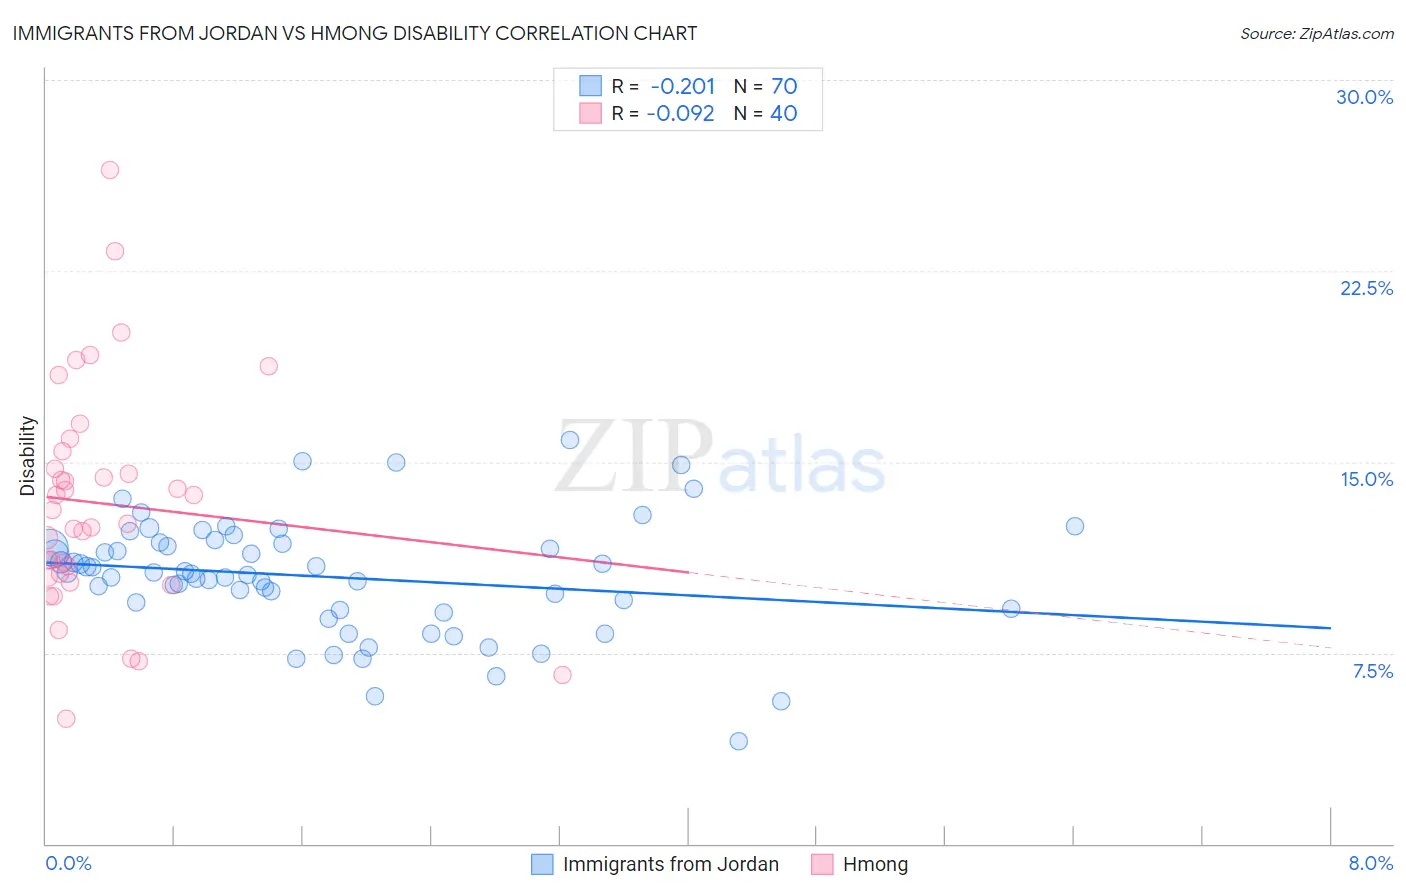
Immigrants from Jordan vs Hmong Disability Correlation Chart
The statistical analysis conducted on geographies consisting of 181,277,491 people shows a weak negative correlation between the proportion of Immigrants from Jordan and percentage of population with a disability in the United States with a correlation coefficient (R) of -0.201 and weighted average of 11.1%. Similarly, the statistical analysis conducted on geographies consisting of 24,681,537 people shows a slight negative correlation between the proportion of Hmong and percentage of population with a disability in the United States with a correlation coefficient (R) of -0.092 and weighted average of 12.8%, a difference of 15.7%.
Disability Correlation Summary
| Measurement | Immigrants from Jordan | Hmong |
| Minimum | 4.0% | 4.9% |
| Maximum | 15.9% | 26.4% |
| Range | 11.8% | 21.5% |
| Mean | 10.5% | 13.4% |
| Median | 10.6% | 12.8% |
| Interquartile 25% (IQ1) | 9.2% | 10.5% |
| Interquartile 75% (IQ3) | 11.8% | 15.1% |
| Interquartile Range (IQR) | 2.5% | 4.5% |
| Standard Deviation (Sample) | 2.3% | 4.4% |
| Standard Deviation (Population) | 2.2% | 4.4% |
Similar Demographics by Disability
Demographics Similar to Immigrants from Jordan by Disability
In terms of disability, the demographic groups most similar to Immigrants from Jordan are Immigrants from Cameroon (11.1%, a difference of 0.040%), Immigrants from Ireland (11.1%, a difference of 0.050%), Immigrants from Belgium (11.0%, a difference of 0.070%), Sierra Leonean (11.0%, a difference of 0.080%), and Immigrants from Vietnam (11.0%, a difference of 0.10%).
| Demographics | Rating | Rank | Disability |
| Immigrants | Chile | 99.4 /100 | #72 | Exceptional 11.0% |
| Immigrants | Bangladesh | 99.4 /100 | #73 | Exceptional 11.0% |
| Immigrants | Serbia | 99.4 /100 | #74 | Exceptional 11.0% |
| Immigrants | Vietnam | 99.4 /100 | #75 | Exceptional 11.0% |
| Sierra Leoneans | 99.3 /100 | #76 | Exceptional 11.0% |
| Immigrants | Belgium | 99.3 /100 | #77 | Exceptional 11.0% |
| Immigrants | Cameroon | 99.3 /100 | #78 | Exceptional 11.1% |
| Immigrants | Jordan | 99.3 /100 | #79 | Exceptional 11.1% |
| Immigrants | Ireland | 99.3 /100 | #80 | Exceptional 11.1% |
| Immigrants | Poland | 99.1 /100 | #81 | Exceptional 11.1% |
| Chileans | 99.1 /100 | #82 | Exceptional 11.1% |
| Immigrants | Switzerland | 99.0 /100 | #83 | Exceptional 11.1% |
| Immigrants | Sierra Leone | 99.0 /100 | #84 | Exceptional 11.1% |
| Immigrants | Belarus | 98.9 /100 | #85 | Exceptional 11.1% |
| Immigrants | Russia | 98.9 /100 | #86 | Exceptional 11.1% |
Demographics Similar to Hmong by Disability
In terms of disability, the demographic groups most similar to Hmong are Dutch (12.8%, a difference of 0.050%), Sioux (12.8%, a difference of 0.15%), German (12.8%, a difference of 0.22%), Nepalese (12.8%, a difference of 0.23%), and Fijian (12.8%, a difference of 0.31%).
| Demographics | Rating | Rank | Disability |
| Immigrants | Dominican Republic | 0.1 /100 | #269 | Tragic 12.6% |
| Portuguese | 0.1 /100 | #270 | Tragic 12.6% |
| Immigrants | Yemen | 0.1 /100 | #271 | Tragic 12.6% |
| Dominicans | 0.0 /100 | #272 | Tragic 12.7% |
| Finns | 0.0 /100 | #273 | Tragic 12.7% |
| Nepalese | 0.0 /100 | #274 | Tragic 12.8% |
| Sioux | 0.0 /100 | #275 | Tragic 12.8% |
| Hmong | 0.0 /100 | #276 | Tragic 12.8% |
| Dutch | 0.0 /100 | #277 | Tragic 12.8% |
| Germans | 0.0 /100 | #278 | Tragic 12.8% |
| Fijians | 0.0 /100 | #279 | Tragic 12.8% |
| Spanish | 0.0 /100 | #280 | Tragic 12.8% |
| Immigrants | Portugal | 0.0 /100 | #281 | Tragic 12.9% |
| Scottish | 0.0 /100 | #282 | Tragic 12.9% |
| Irish | 0.0 /100 | #283 | Tragic 12.9% |