Portuguese vs Basque Disability Age Under 5
COMPARE
Portuguese
Basque
Disability Age Under 5
Disability Age Under 5 Comparison
Portuguese
Basques
1.6%
DISABILITY AGE UNDER 5
0.0/ 100
METRIC RATING
299th/ 347
METRIC RANK
1.3%
DISABILITY AGE UNDER 5
3.0/ 100
METRIC RATING
237th/ 347
METRIC RANK
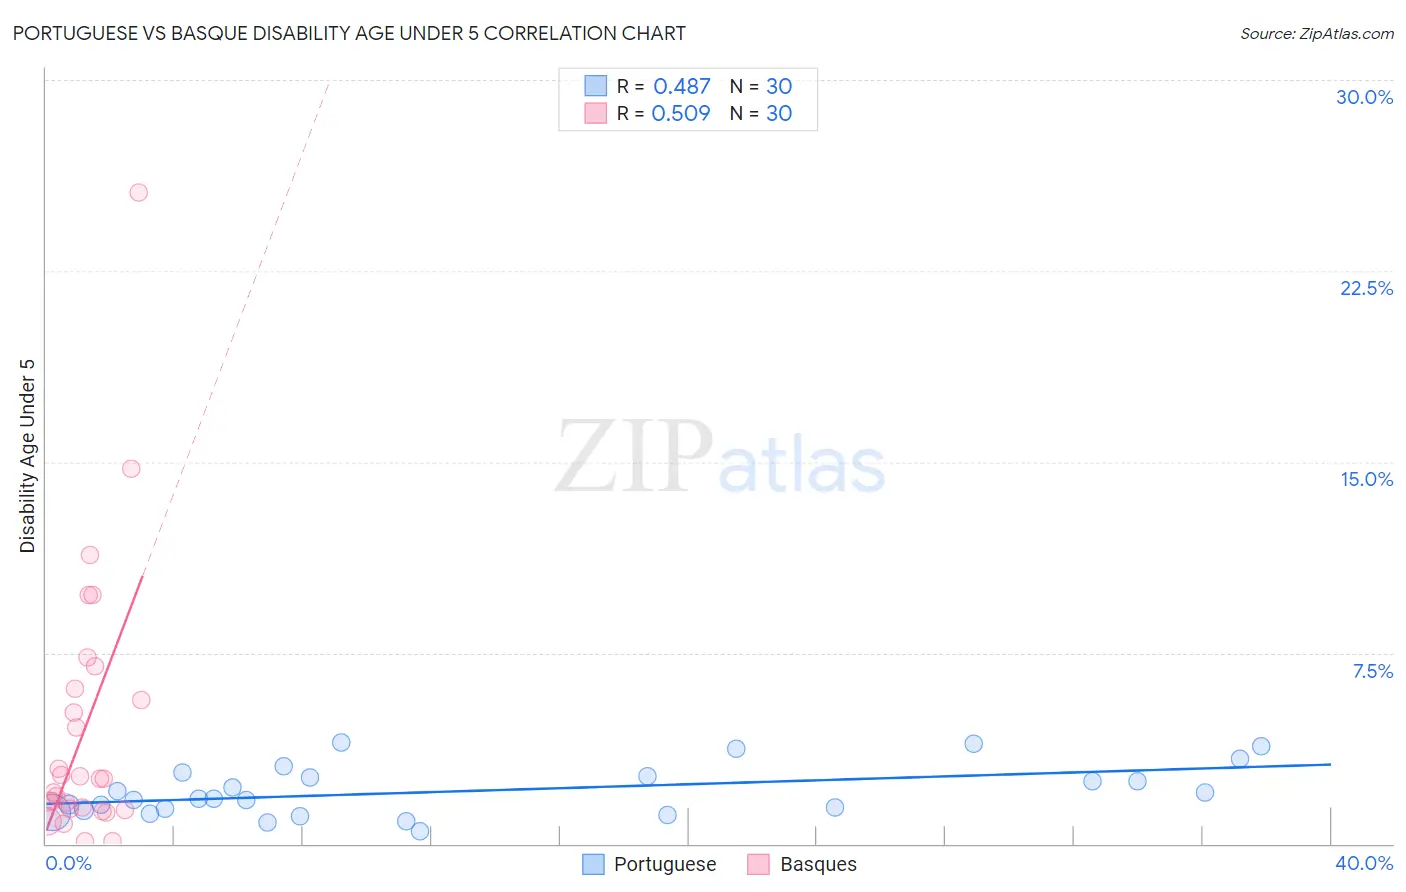
Portuguese vs Basque Disability Age Under 5 Correlation Chart
The statistical analysis conducted on geographies consisting of 231,785,115 people shows a moderate positive correlation between the proportion of Portuguese and percentage of population with a disability under the age of 5 in the United States with a correlation coefficient (R) of 0.487 and weighted average of 1.6%. Similarly, the statistical analysis conducted on geographies consisting of 115,640,652 people shows a substantial positive correlation between the proportion of Basques and percentage of population with a disability under the age of 5 in the United States with a correlation coefficient (R) of 0.509 and weighted average of 1.3%, a difference of 20.7%.
Disability Age Under 5 Correlation Summary
| Measurement | Portuguese | Basque |
| Minimum | 0.48% | 0.11% |
| Maximum | 4.0% | 25.6% |
| Range | 3.5% | 25.5% |
| Mean | 2.1% | 4.6% |
| Median | 1.8% | 2.5% |
| Interquartile 25% (IQ1) | 1.3% | 1.4% |
| Interquartile 75% (IQ3) | 2.6% | 6.1% |
| Interquartile Range (IQR) | 1.3% | 4.7% |
| Standard Deviation (Sample) | 0.99% | 5.4% |
| Standard Deviation (Population) | 0.97% | 5.3% |
Similar Demographics by Disability Age Under 5
Demographics Similar to Portuguese by Disability Age Under 5
In terms of disability age under 5, the demographic groups most similar to Portuguese are Shoshone (1.6%, a difference of 0.33%), Cajun (1.6%, a difference of 0.57%), Nonimmigrants (1.6%, a difference of 0.58%), German Russian (1.6%, a difference of 0.78%), and Welsh (1.6%, a difference of 0.89%).
| Demographics | Rating | Rank | Disability Age Under 5 |
| Italians | 0.0 /100 | #292 | Tragic 1.6% |
| Lithuanians | 0.0 /100 | #293 | Tragic 1.6% |
| Swedes | 0.0 /100 | #294 | Tragic 1.6% |
| Finns | 0.0 /100 | #295 | Tragic 1.6% |
| Poles | 0.0 /100 | #296 | Tragic 1.6% |
| Immigrants | Nonimmigrants | 0.0 /100 | #297 | Tragic 1.6% |
| Cajuns | 0.0 /100 | #298 | Tragic 1.6% |
| Portuguese | 0.0 /100 | #299 | Tragic 1.6% |
| Shoshone | 0.0 /100 | #300 | Tragic 1.6% |
| German Russians | 0.0 /100 | #301 | Tragic 1.6% |
| Welsh | 0.0 /100 | #302 | Tragic 1.6% |
| Swiss | 0.0 /100 | #303 | Tragic 1.6% |
| Seminole | 0.0 /100 | #304 | Tragic 1.6% |
| Blackfeet | 0.0 /100 | #305 | Tragic 1.6% |
| Creek | 0.0 /100 | #306 | Tragic 1.6% |
Demographics Similar to Basques by Disability Age Under 5
In terms of disability age under 5, the demographic groups most similar to Basques are South American Indian (1.3%, a difference of 0.24%), Spanish American Indian (1.3%, a difference of 0.43%), Central American Indian (1.3%, a difference of 0.44%), Pueblo (1.3%, a difference of 0.51%), and Immigrants from Austria (1.3%, a difference of 0.59%).
| Demographics | Rating | Rank | Disability Age Under 5 |
| Lebanese | 5.3 /100 | #230 | Tragic 1.3% |
| Immigrants | Northern Europe | 4.7 /100 | #231 | Tragic 1.3% |
| French American Indians | 4.5 /100 | #232 | Tragic 1.3% |
| Tongans | 4.2 /100 | #233 | Tragic 1.3% |
| Pueblo | 3.8 /100 | #234 | Tragic 1.3% |
| Central American Indians | 3.6 /100 | #235 | Tragic 1.3% |
| South American Indians | 3.3 /100 | #236 | Tragic 1.3% |
| Basques | 3.0 /100 | #237 | Tragic 1.3% |
| Spanish American Indians | 2.4 /100 | #238 | Tragic 1.3% |
| Immigrants | Austria | 2.3 /100 | #239 | Tragic 1.3% |
| Native Hawaiians | 2.2 /100 | #240 | Tragic 1.3% |
| Maltese | 2.2 /100 | #241 | Tragic 1.3% |
| Lumbee | 2.1 /100 | #242 | Tragic 1.3% |
| Immigrants | Cameroon | 1.7 /100 | #243 | Tragic 1.4% |
| Spaniards | 1.4 /100 | #244 | Tragic 1.4% |