Nicaraguan vs Basque Disability Age Under 5
COMPARE
Nicaraguan
Basque
Disability Age Under 5
Disability Age Under 5 Comparison
Nicaraguans
Basques
1.1%
DISABILITY AGE UNDER 5
96.3/ 100
METRIC RATING
100th/ 347
METRIC RANK
1.3%
DISABILITY AGE UNDER 5
3.0/ 100
METRIC RATING
237th/ 347
METRIC RANK
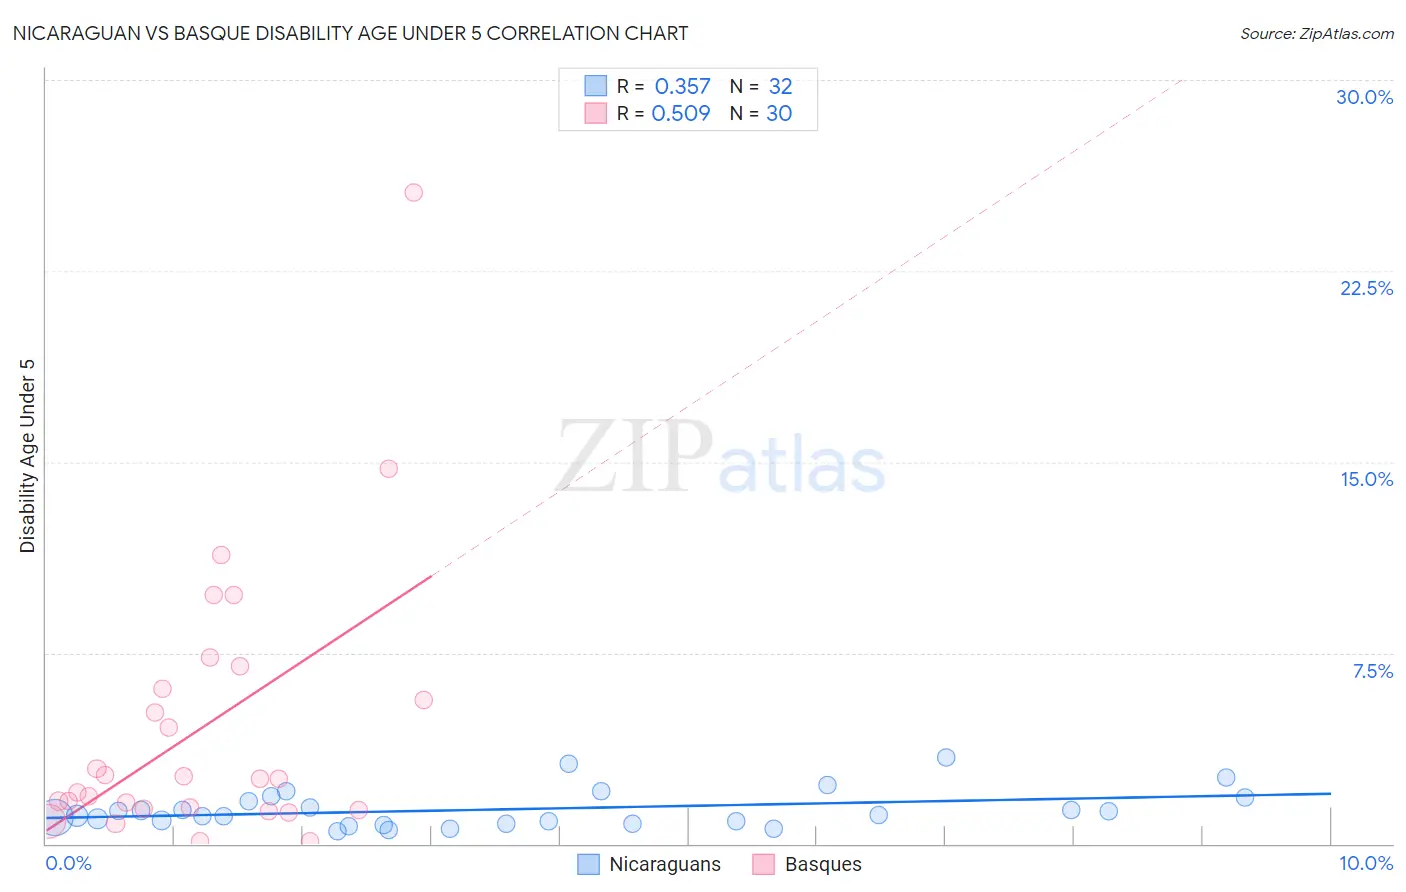
Nicaraguan vs Basque Disability Age Under 5 Correlation Chart
The statistical analysis conducted on geographies consisting of 175,073,475 people shows a mild positive correlation between the proportion of Nicaraguans and percentage of population with a disability under the age of 5 in the United States with a correlation coefficient (R) of 0.357 and weighted average of 1.1%. Similarly, the statistical analysis conducted on geographies consisting of 115,640,652 people shows a substantial positive correlation between the proportion of Basques and percentage of population with a disability under the age of 5 in the United States with a correlation coefficient (R) of 0.509 and weighted average of 1.3%, a difference of 16.4%.
Disability Age Under 5 Correlation Summary
| Measurement | Nicaraguan | Basque |
| Minimum | 0.49% | 0.11% |
| Maximum | 3.4% | 25.6% |
| Range | 2.9% | 25.5% |
| Mean | 1.3% | 4.6% |
| Median | 1.1% | 2.5% |
| Interquartile 25% (IQ1) | 0.84% | 1.4% |
| Interquartile 75% (IQ3) | 1.7% | 6.1% |
| Interquartile Range (IQR) | 0.90% | 4.7% |
| Standard Deviation (Sample) | 0.73% | 5.4% |
| Standard Deviation (Population) | 0.72% | 5.3% |
Similar Demographics by Disability Age Under 5
Demographics Similar to Nicaraguans by Disability Age Under 5
In terms of disability age under 5, the demographic groups most similar to Nicaraguans are Dominican (1.1%, a difference of 0.030%), Immigrants from Uganda (1.1%, a difference of 0.11%), Immigrants from South Eastern Asia (1.1%, a difference of 0.15%), Immigrants from Iraq (1.1%, a difference of 0.17%), and Immigrants from Morocco (1.2%, a difference of 0.17%).
| Demographics | Rating | Rank | Disability Age Under 5 |
| Spanish Americans | 96.9 /100 | #93 | Exceptional 1.1% |
| Sri Lankans | 96.8 /100 | #94 | Exceptional 1.1% |
| Immigrants | Moldova | 96.8 /100 | #95 | Exceptional 1.1% |
| Mongolians | 96.6 /100 | #96 | Exceptional 1.1% |
| Immigrants | Iraq | 96.5 /100 | #97 | Exceptional 1.1% |
| Immigrants | South Eastern Asia | 96.5 /100 | #98 | Exceptional 1.1% |
| Dominicans | 96.3 /100 | #99 | Exceptional 1.1% |
| Nicaraguans | 96.3 /100 | #100 | Exceptional 1.1% |
| Immigrants | Uganda | 96.1 /100 | #101 | Exceptional 1.1% |
| Immigrants | Morocco | 96.0 /100 | #102 | Exceptional 1.2% |
| Immigrants | Nicaragua | 96.0 /100 | #103 | Exceptional 1.2% |
| Indonesians | 95.9 /100 | #104 | Exceptional 1.2% |
| Immigrants | South Africa | 95.6 /100 | #105 | Exceptional 1.2% |
| Cambodians | 95.4 /100 | #106 | Exceptional 1.2% |
| Immigrants | West Indies | 95.3 /100 | #107 | Exceptional 1.2% |
Demographics Similar to Basques by Disability Age Under 5
In terms of disability age under 5, the demographic groups most similar to Basques are South American Indian (1.3%, a difference of 0.24%), Spanish American Indian (1.3%, a difference of 0.43%), Central American Indian (1.3%, a difference of 0.44%), Pueblo (1.3%, a difference of 0.51%), and Immigrants from Austria (1.3%, a difference of 0.59%).
| Demographics | Rating | Rank | Disability Age Under 5 |
| Lebanese | 5.3 /100 | #230 | Tragic 1.3% |
| Immigrants | Northern Europe | 4.7 /100 | #231 | Tragic 1.3% |
| French American Indians | 4.5 /100 | #232 | Tragic 1.3% |
| Tongans | 4.2 /100 | #233 | Tragic 1.3% |
| Pueblo | 3.8 /100 | #234 | Tragic 1.3% |
| Central American Indians | 3.6 /100 | #235 | Tragic 1.3% |
| South American Indians | 3.3 /100 | #236 | Tragic 1.3% |
| Basques | 3.0 /100 | #237 | Tragic 1.3% |
| Spanish American Indians | 2.4 /100 | #238 | Tragic 1.3% |
| Immigrants | Austria | 2.3 /100 | #239 | Tragic 1.3% |
| Native Hawaiians | 2.2 /100 | #240 | Tragic 1.3% |
| Maltese | 2.2 /100 | #241 | Tragic 1.3% |
| Lumbee | 2.1 /100 | #242 | Tragic 1.3% |
| Immigrants | Cameroon | 1.7 /100 | #243 | Tragic 1.4% |
| Spaniards | 1.4 /100 | #244 | Tragic 1.4% |