Japanese vs Basque Disability Age Under 5
COMPARE
Japanese
Basque
Disability Age Under 5
Disability Age Under 5 Comparison
Japanese
Basques
1.2%
DISABILITY AGE UNDER 5
90.3/ 100
METRIC RATING
125th/ 347
METRIC RANK
1.3%
DISABILITY AGE UNDER 5
3.0/ 100
METRIC RATING
237th/ 347
METRIC RANK
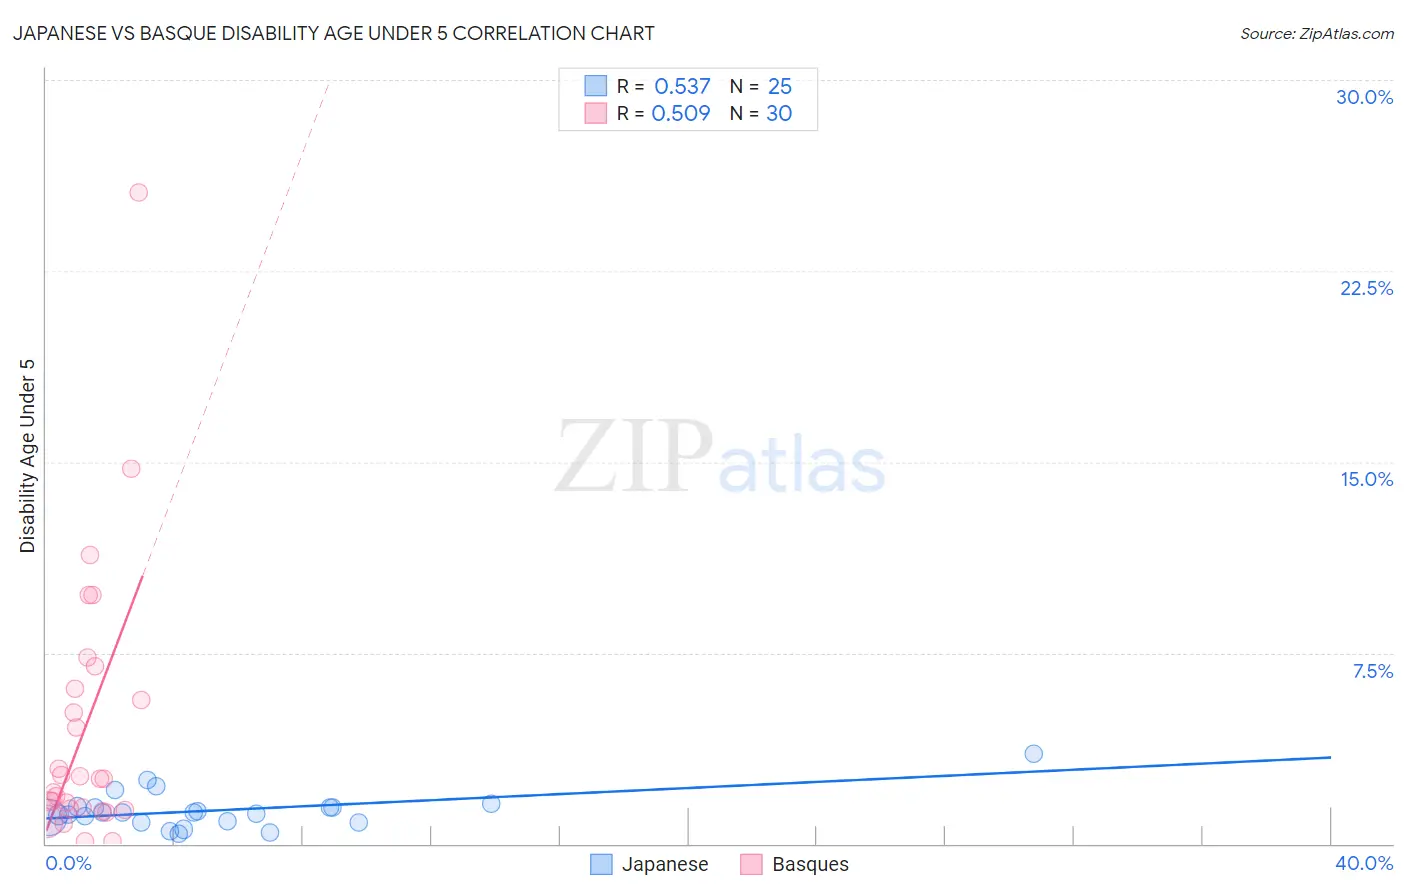
Japanese vs Basque Disability Age Under 5 Correlation Chart
The statistical analysis conducted on geographies consisting of 161,189,921 people shows a substantial positive correlation between the proportion of Japanese and percentage of population with a disability under the age of 5 in the United States with a correlation coefficient (R) of 0.537 and weighted average of 1.2%. Similarly, the statistical analysis conducted on geographies consisting of 115,640,652 people shows a substantial positive correlation between the proportion of Basques and percentage of population with a disability under the age of 5 in the United States with a correlation coefficient (R) of 0.509 and weighted average of 1.3%, a difference of 13.6%.
Disability Age Under 5 Correlation Summary
| Measurement | Japanese | Basque |
| Minimum | 0.40% | 0.11% |
| Maximum | 3.5% | 25.6% |
| Range | 3.1% | 25.5% |
| Mean | 1.3% | 4.6% |
| Median | 1.2% | 2.5% |
| Interquartile 25% (IQ1) | 0.87% | 1.4% |
| Interquartile 75% (IQ3) | 1.4% | 6.1% |
| Interquartile Range (IQR) | 0.58% | 4.7% |
| Standard Deviation (Sample) | 0.70% | 5.4% |
| Standard Deviation (Population) | 0.69% | 5.3% |
Similar Demographics by Disability Age Under 5
Demographics Similar to Japanese by Disability Age Under 5
In terms of disability age under 5, the demographic groups most similar to Japanese are Immigrants from Cambodia (1.2%, a difference of 0.060%), Zimbabwean (1.2%, a difference of 0.080%), Aleut (1.2%, a difference of 0.13%), Central American (1.2%, a difference of 0.16%), and Immigrants from Senegal (1.2%, a difference of 0.32%).
| Demographics | Rating | Rank | Disability Age Under 5 |
| Immigrants | Venezuela | 93.4 /100 | #118 | Exceptional 1.2% |
| Bhutanese | 92.5 /100 | #119 | Exceptional 1.2% |
| Immigrants | Eritrea | 92.3 /100 | #120 | Exceptional 1.2% |
| Immigrants | Senegal | 91.4 /100 | #121 | Exceptional 1.2% |
| Aleuts | 90.7 /100 | #122 | Exceptional 1.2% |
| Zimbabweans | 90.6 /100 | #123 | Exceptional 1.2% |
| Immigrants | Cambodia | 90.5 /100 | #124 | Exceptional 1.2% |
| Japanese | 90.3 /100 | #125 | Exceptional 1.2% |
| Central Americans | 89.7 /100 | #126 | Excellent 1.2% |
| Immigrants | Romania | 88.4 /100 | #127 | Excellent 1.2% |
| Immigrants | France | 88.4 /100 | #128 | Excellent 1.2% |
| Immigrants | Immigrants | 88.0 /100 | #129 | Excellent 1.2% |
| Koreans | 87.7 /100 | #130 | Excellent 1.2% |
| Immigrants | Serbia | 87.6 /100 | #131 | Excellent 1.2% |
| Immigrants | Eastern Europe | 87.3 /100 | #132 | Excellent 1.2% |
Demographics Similar to Basques by Disability Age Under 5
In terms of disability age under 5, the demographic groups most similar to Basques are South American Indian (1.3%, a difference of 0.24%), Spanish American Indian (1.3%, a difference of 0.43%), Central American Indian (1.3%, a difference of 0.44%), Pueblo (1.3%, a difference of 0.51%), and Immigrants from Austria (1.3%, a difference of 0.59%).
| Demographics | Rating | Rank | Disability Age Under 5 |
| Lebanese | 5.3 /100 | #230 | Tragic 1.3% |
| Immigrants | Northern Europe | 4.7 /100 | #231 | Tragic 1.3% |
| French American Indians | 4.5 /100 | #232 | Tragic 1.3% |
| Tongans | 4.2 /100 | #233 | Tragic 1.3% |
| Pueblo | 3.8 /100 | #234 | Tragic 1.3% |
| Central American Indians | 3.6 /100 | #235 | Tragic 1.3% |
| South American Indians | 3.3 /100 | #236 | Tragic 1.3% |
| Basques | 3.0 /100 | #237 | Tragic 1.3% |
| Spanish American Indians | 2.4 /100 | #238 | Tragic 1.3% |
| Immigrants | Austria | 2.3 /100 | #239 | Tragic 1.3% |
| Native Hawaiians | 2.2 /100 | #240 | Tragic 1.3% |
| Maltese | 2.2 /100 | #241 | Tragic 1.3% |
| Lumbee | 2.1 /100 | #242 | Tragic 1.3% |
| Immigrants | Cameroon | 1.7 /100 | #243 | Tragic 1.4% |
| Spaniards | 1.4 /100 | #244 | Tragic 1.4% |