Spanish vs Basque Disability Age Under 5
COMPARE
Spanish
Basque
Disability Age Under 5
Disability Age Under 5 Comparison
Spanish
Basques
1.4%
DISABILITY AGE UNDER 5
0.2/ 100
METRIC RATING
263rd/ 347
METRIC RANK
1.3%
DISABILITY AGE UNDER 5
3.0/ 100
METRIC RATING
237th/ 347
METRIC RANK
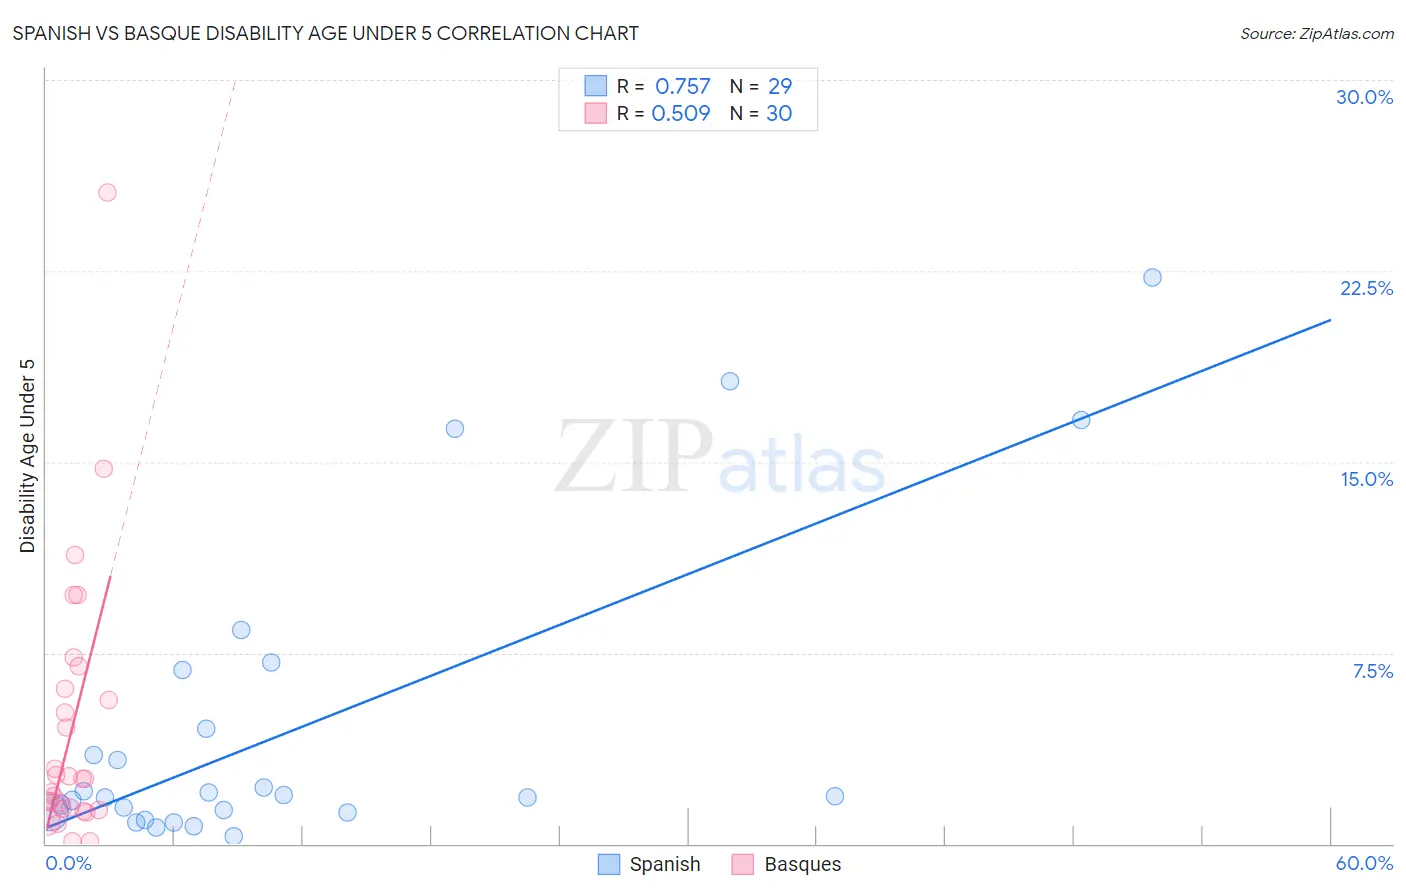
Spanish vs Basque Disability Age Under 5 Correlation Chart
The statistical analysis conducted on geographies consisting of 226,460,629 people shows a strong positive correlation between the proportion of Spanish and percentage of population with a disability under the age of 5 in the United States with a correlation coefficient (R) of 0.757 and weighted average of 1.4%. Similarly, the statistical analysis conducted on geographies consisting of 115,640,652 people shows a substantial positive correlation between the proportion of Basques and percentage of population with a disability under the age of 5 in the United States with a correlation coefficient (R) of 0.509 and weighted average of 1.3%, a difference of 6.2%.
Disability Age Under 5 Correlation Summary
| Measurement | Spanish | Basque |
| Minimum | 0.27% | 0.11% |
| Maximum | 22.2% | 25.6% |
| Range | 21.9% | 25.5% |
| Mean | 4.6% | 4.6% |
| Median | 1.9% | 2.5% |
| Interquartile 25% (IQ1) | 1.2% | 1.4% |
| Interquartile 75% (IQ3) | 5.7% | 6.1% |
| Interquartile Range (IQR) | 4.4% | 4.7% |
| Standard Deviation (Sample) | 6.0% | 5.4% |
| Standard Deviation (Population) | 5.9% | 5.3% |
Similar Demographics by Disability Age Under 5
Demographics Similar to Spanish by Disability Age Under 5
In terms of disability age under 5, the demographic groups most similar to Spanish are Immigrants from Dominica (1.4%, a difference of 0.060%), Yugoslavian (1.4%, a difference of 0.15%), Carpatho Rusyn (1.4%, a difference of 0.19%), Immigrants from Netherlands (1.4%, a difference of 0.22%), and Immigrants from Germany (1.4%, a difference of 0.22%).
| Demographics | Rating | Rank | Disability Age Under 5 |
| Immigrants | Western Europe | 0.5 /100 | #256 | Tragic 1.4% |
| Slovenes | 0.3 /100 | #257 | Tragic 1.4% |
| Costa Ricans | 0.3 /100 | #258 | Tragic 1.4% |
| Immigrants | Southern Europe | 0.3 /100 | #259 | Tragic 1.4% |
| Slavs | 0.3 /100 | #260 | Tragic 1.4% |
| Immigrants | Netherlands | 0.2 /100 | #261 | Tragic 1.4% |
| Immigrants | Dominica | 0.2 /100 | #262 | Tragic 1.4% |
| Spanish | 0.2 /100 | #263 | Tragic 1.4% |
| Yugoslavians | 0.1 /100 | #264 | Tragic 1.4% |
| Carpatho Rusyns | 0.1 /100 | #265 | Tragic 1.4% |
| Immigrants | Germany | 0.1 /100 | #266 | Tragic 1.4% |
| Cree | 0.1 /100 | #267 | Tragic 1.4% |
| Belgians | 0.1 /100 | #268 | Tragic 1.4% |
| Austrians | 0.1 /100 | #269 | Tragic 1.4% |
| Immigrants | North America | 0.1 /100 | #270 | Tragic 1.4% |
Demographics Similar to Basques by Disability Age Under 5
In terms of disability age under 5, the demographic groups most similar to Basques are South American Indian (1.3%, a difference of 0.24%), Spanish American Indian (1.3%, a difference of 0.43%), Central American Indian (1.3%, a difference of 0.44%), Pueblo (1.3%, a difference of 0.51%), and Immigrants from Austria (1.3%, a difference of 0.59%).
| Demographics | Rating | Rank | Disability Age Under 5 |
| Lebanese | 5.3 /100 | #230 | Tragic 1.3% |
| Immigrants | Northern Europe | 4.7 /100 | #231 | Tragic 1.3% |
| French American Indians | 4.5 /100 | #232 | Tragic 1.3% |
| Tongans | 4.2 /100 | #233 | Tragic 1.3% |
| Pueblo | 3.8 /100 | #234 | Tragic 1.3% |
| Central American Indians | 3.6 /100 | #235 | Tragic 1.3% |
| South American Indians | 3.3 /100 | #236 | Tragic 1.3% |
| Basques | 3.0 /100 | #237 | Tragic 1.3% |
| Spanish American Indians | 2.4 /100 | #238 | Tragic 1.3% |
| Immigrants | Austria | 2.3 /100 | #239 | Tragic 1.3% |
| Native Hawaiians | 2.2 /100 | #240 | Tragic 1.3% |
| Maltese | 2.2 /100 | #241 | Tragic 1.3% |
| Lumbee | 2.1 /100 | #242 | Tragic 1.3% |
| Immigrants | Cameroon | 1.7 /100 | #243 | Tragic 1.4% |
| Spaniards | 1.4 /100 | #244 | Tragic 1.4% |