Immigrants from Russia vs Basque Disability Age Under 5
COMPARE
Immigrants from Russia
Basque
Disability Age Under 5
Disability Age Under 5 Comparison
Immigrants from Russia
Basques
1.1%
DISABILITY AGE UNDER 5
99.7/ 100
METRIC RATING
49th/ 347
METRIC RANK
1.3%
DISABILITY AGE UNDER 5
3.0/ 100
METRIC RATING
237th/ 347
METRIC RANK
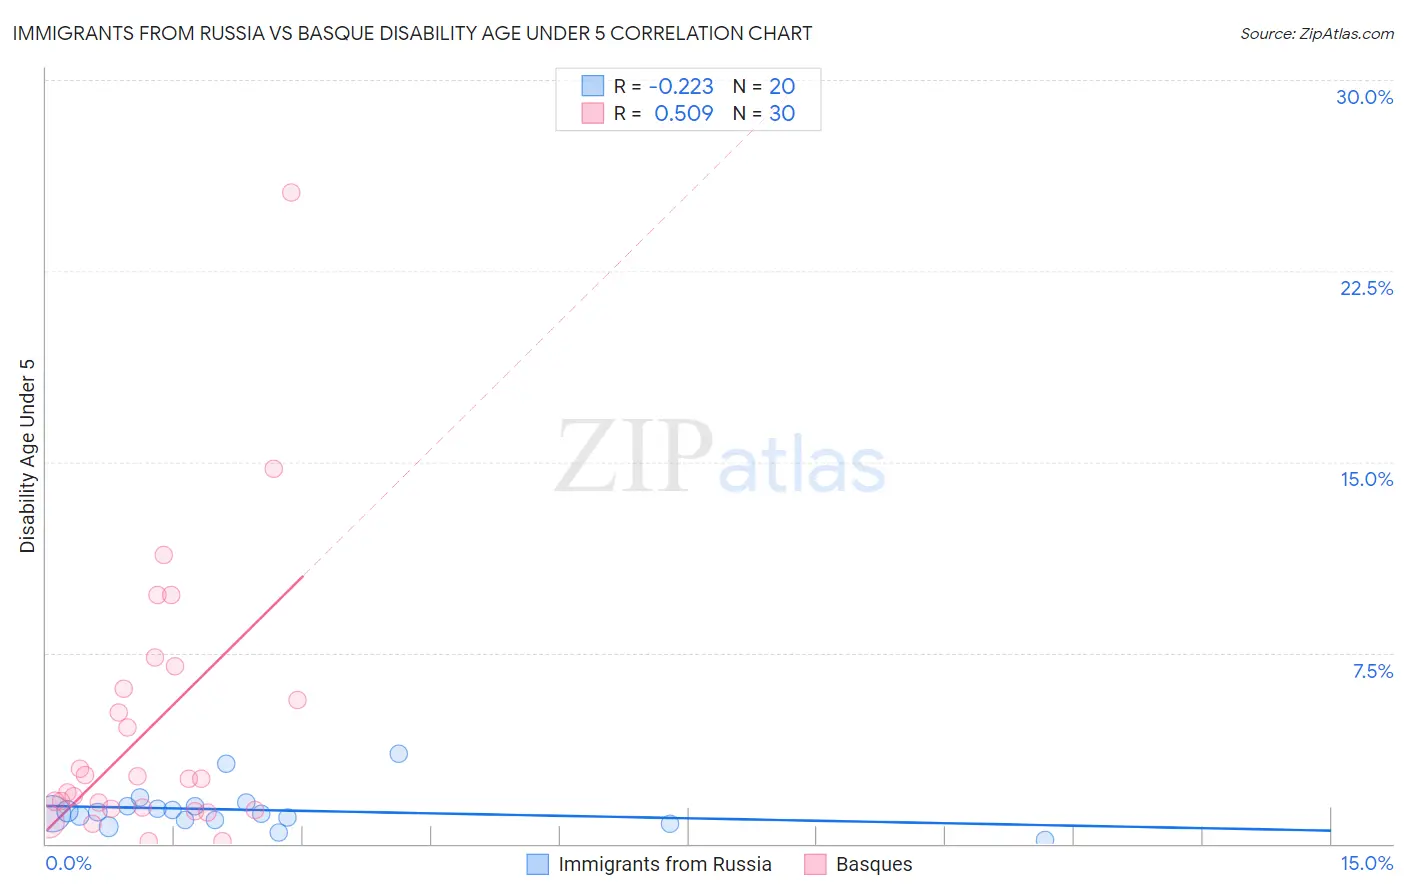
Immigrants from Russia vs Basque Disability Age Under 5 Correlation Chart
The statistical analysis conducted on geographies consisting of 192,972,084 people shows a weak negative correlation between the proportion of Immigrants from Russia and percentage of population with a disability under the age of 5 in the United States with a correlation coefficient (R) of -0.223 and weighted average of 1.1%. Similarly, the statistical analysis conducted on geographies consisting of 115,640,652 people shows a substantial positive correlation between the proportion of Basques and percentage of population with a disability under the age of 5 in the United States with a correlation coefficient (R) of 0.509 and weighted average of 1.3%, a difference of 24.4%.
Disability Age Under 5 Correlation Summary
| Measurement | Immigrants from Russia | Basque |
| Minimum | 0.14% | 0.11% |
| Maximum | 3.5% | 25.6% |
| Range | 3.4% | 25.5% |
| Mean | 1.3% | 4.6% |
| Median | 1.2% | 2.5% |
| Interquartile 25% (IQ1) | 0.95% | 1.4% |
| Interquartile 75% (IQ3) | 1.5% | 6.1% |
| Interquartile Range (IQR) | 0.53% | 4.7% |
| Standard Deviation (Sample) | 0.79% | 5.4% |
| Standard Deviation (Population) | 0.77% | 5.3% |
Similar Demographics by Disability Age Under 5
Demographics Similar to Immigrants from Russia by Disability Age Under 5
In terms of disability age under 5, the demographic groups most similar to Immigrants from Russia are Immigrants from Japan (1.1%, a difference of 0.020%), Immigrants from Kazakhstan (1.1%, a difference of 0.20%), Immigrants from Singapore (1.1%, a difference of 0.21%), Immigrants from Sweden (1.1%, a difference of 0.43%), and Immigrants from Congo (1.1%, a difference of 0.57%).
| Demographics | Rating | Rank | Disability Age Under 5 |
| Immigrants | Bulgaria | 99.8 /100 | #42 | Exceptional 1.1% |
| Pima | 99.8 /100 | #43 | Exceptional 1.1% |
| Immigrants | Asia | 99.8 /100 | #44 | Exceptional 1.1% |
| Immigrants | Turkey | 99.8 /100 | #45 | Exceptional 1.1% |
| Immigrants | Congo | 99.8 /100 | #46 | Exceptional 1.1% |
| Immigrants | Sweden | 99.8 /100 | #47 | Exceptional 1.1% |
| Immigrants | Singapore | 99.7 /100 | #48 | Exceptional 1.1% |
| Immigrants | Russia | 99.7 /100 | #49 | Exceptional 1.1% |
| Immigrants | Japan | 99.7 /100 | #50 | Exceptional 1.1% |
| Immigrants | Kazakhstan | 99.7 /100 | #51 | Exceptional 1.1% |
| Immigrants | Bolivia | 99.6 /100 | #52 | Exceptional 1.1% |
| Asians | 99.6 /100 | #53 | Exceptional 1.1% |
| Immigrants | El Salvador | 99.6 /100 | #54 | Exceptional 1.1% |
| Salvadorans | 99.5 /100 | #55 | Exceptional 1.1% |
| Ecuadorians | 99.5 /100 | #56 | Exceptional 1.1% |
Demographics Similar to Basques by Disability Age Under 5
In terms of disability age under 5, the demographic groups most similar to Basques are South American Indian (1.3%, a difference of 0.24%), Spanish American Indian (1.3%, a difference of 0.43%), Central American Indian (1.3%, a difference of 0.44%), Pueblo (1.3%, a difference of 0.51%), and Immigrants from Austria (1.3%, a difference of 0.59%).
| Demographics | Rating | Rank | Disability Age Under 5 |
| Lebanese | 5.3 /100 | #230 | Tragic 1.3% |
| Immigrants | Northern Europe | 4.7 /100 | #231 | Tragic 1.3% |
| French American Indians | 4.5 /100 | #232 | Tragic 1.3% |
| Tongans | 4.2 /100 | #233 | Tragic 1.3% |
| Pueblo | 3.8 /100 | #234 | Tragic 1.3% |
| Central American Indians | 3.6 /100 | #235 | Tragic 1.3% |
| South American Indians | 3.3 /100 | #236 | Tragic 1.3% |
| Basques | 3.0 /100 | #237 | Tragic 1.3% |
| Spanish American Indians | 2.4 /100 | #238 | Tragic 1.3% |
| Immigrants | Austria | 2.3 /100 | #239 | Tragic 1.3% |
| Native Hawaiians | 2.2 /100 | #240 | Tragic 1.3% |
| Maltese | 2.2 /100 | #241 | Tragic 1.3% |
| Lumbee | 2.1 /100 | #242 | Tragic 1.3% |
| Immigrants | Cameroon | 1.7 /100 | #243 | Tragic 1.4% |
| Spaniards | 1.4 /100 | #244 | Tragic 1.4% |