Pima vs Immigrants from Lebanon Hearing Disability
COMPARE
Pima
Immigrants from Lebanon
Hearing Disability
Hearing Disability Comparison
Pima
Immigrants from Lebanon
3.7%
HEARING DISABILITY
0.0/ 100
METRIC RATING
296th/ 347
METRIC RANK
2.9%
HEARING DISABILITY
71.5/ 100
METRIC RATING
154th/ 347
METRIC RANK
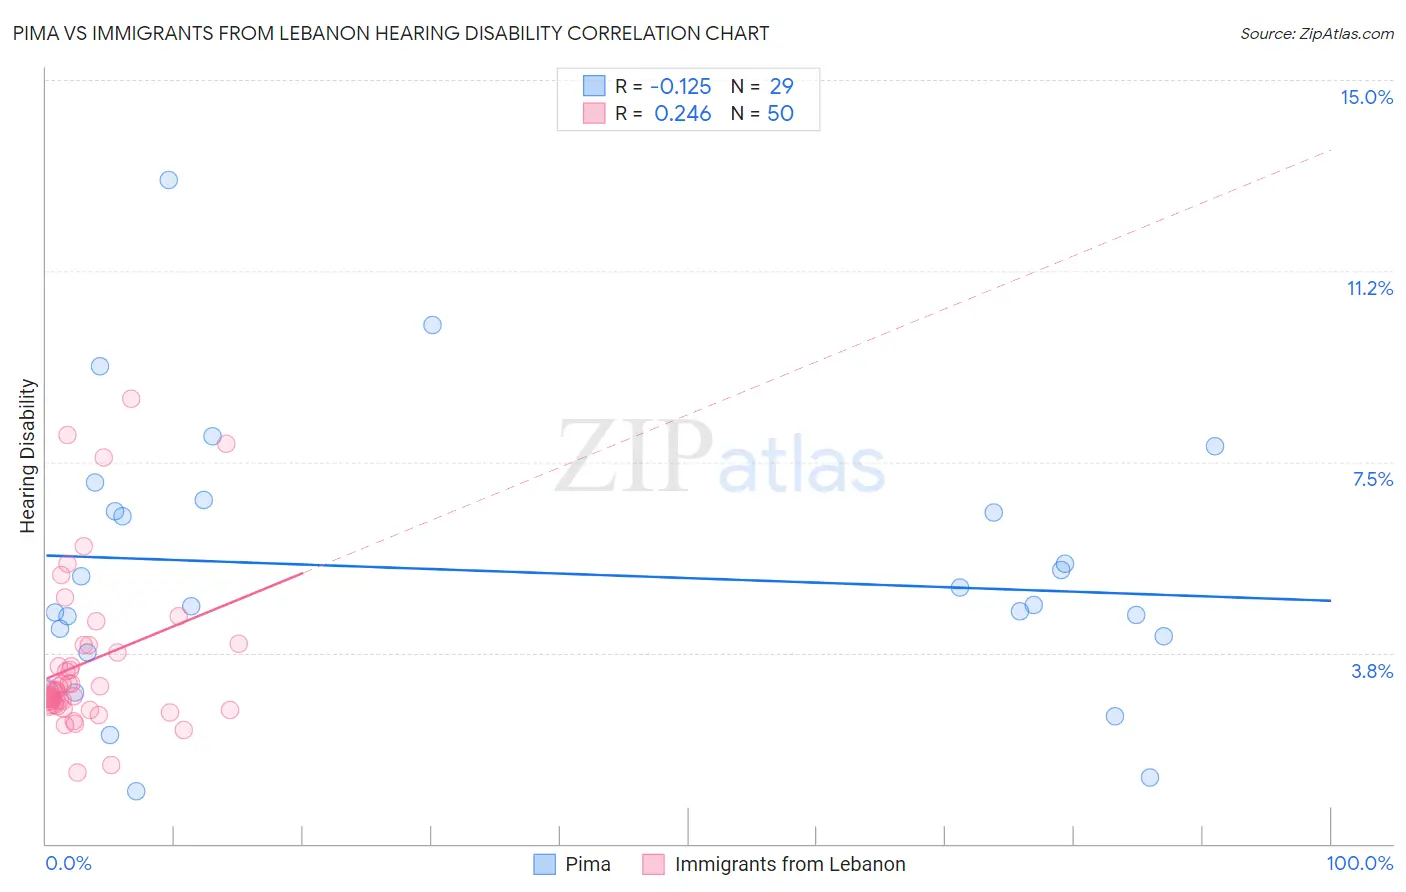
Pima vs Immigrants from Lebanon Hearing Disability Correlation Chart
The statistical analysis conducted on geographies consisting of 61,536,530 people shows a poor negative correlation between the proportion of Pima and percentage of population with hearing disability in the United States with a correlation coefficient (R) of -0.125 and weighted average of 3.7%. Similarly, the statistical analysis conducted on geographies consisting of 217,145,766 people shows a weak positive correlation between the proportion of Immigrants from Lebanon and percentage of population with hearing disability in the United States with a correlation coefficient (R) of 0.246 and weighted average of 2.9%, a difference of 26.7%.
Hearing Disability Correlation Summary
| Measurement | Pima | Immigrants from Lebanon |
| Minimum | 1.0% | 1.4% |
| Maximum | 13.0% | 8.7% |
| Range | 12.0% | 7.3% |
| Mean | 5.4% | 3.6% |
| Median | 4.7% | 3.0% |
| Interquartile 25% (IQ1) | 3.9% | 2.7% |
| Interquartile 75% (IQ3) | 6.6% | 3.9% |
| Interquartile Range (IQR) | 2.7% | 1.2% |
| Standard Deviation (Sample) | 2.6% | 1.6% |
| Standard Deviation (Population) | 2.6% | 1.6% |
Similar Demographics by Hearing Disability
Demographics Similar to Pima by Hearing Disability
In terms of hearing disability, the demographic groups most similar to Pima are Immigrants from the Azores (3.7%, a difference of 0.070%), Welsh (3.7%, a difference of 0.13%), Celtic (3.7%, a difference of 0.26%), Iroquois (3.7%, a difference of 0.39%), and German (3.7%, a difference of 0.54%).
| Demographics | Rating | Rank | Hearing Disability |
| Chinese | 0.0 /100 | #289 | Tragic 3.7% |
| Whites/Caucasians | 0.0 /100 | #290 | Tragic 3.7% |
| Finns | 0.0 /100 | #291 | Tragic 3.7% |
| Native Hawaiians | 0.0 /100 | #292 | Tragic 3.7% |
| Norwegians | 0.0 /100 | #293 | Tragic 3.7% |
| Iroquois | 0.0 /100 | #294 | Tragic 3.7% |
| Welsh | 0.0 /100 | #295 | Tragic 3.7% |
| Pima | 0.0 /100 | #296 | Tragic 3.7% |
| Immigrants | Azores | 0.0 /100 | #297 | Tragic 3.7% |
| Celtics | 0.0 /100 | #298 | Tragic 3.7% |
| Germans | 0.0 /100 | #299 | Tragic 3.7% |
| Scottish | 0.0 /100 | #300 | Tragic 3.7% |
| Pennsylvania Germans | 0.0 /100 | #301 | Tragic 3.7% |
| Dutch | 0.0 /100 | #302 | Tragic 3.7% |
| Menominee | 0.0 /100 | #303 | Tragic 3.7% |
Demographics Similar to Immigrants from Lebanon by Hearing Disability
In terms of hearing disability, the demographic groups most similar to Immigrants from Lebanon are Costa Rican (2.9%, a difference of 0.010%), Sudanese (2.9%, a difference of 0.070%), Immigrants from Poland (2.9%, a difference of 0.15%), Immigrants from Lithuania (2.9%, a difference of 0.18%), and Immigrants from France (2.9%, a difference of 0.19%).
| Demographics | Rating | Rank | Hearing Disability |
| Tongans | 78.6 /100 | #147 | Good 2.9% |
| Immigrants | Russia | 77.7 /100 | #148 | Good 2.9% |
| Immigrants | Panama | 76.9 /100 | #149 | Good 2.9% |
| Palestinians | 73.6 /100 | #150 | Good 2.9% |
| Immigrants | France | 73.1 /100 | #151 | Good 2.9% |
| Immigrants | Lithuania | 73.0 /100 | #152 | Good 2.9% |
| Sudanese | 72.1 /100 | #153 | Good 2.9% |
| Immigrants | Lebanon | 71.5 /100 | #154 | Good 2.9% |
| Costa Ricans | 71.4 /100 | #155 | Good 2.9% |
| Immigrants | Poland | 70.2 /100 | #156 | Good 2.9% |
| Immigrants | Kazakhstan | 69.6 /100 | #157 | Good 2.9% |
| Immigrants | Burma/Myanmar | 69.5 /100 | #158 | Good 2.9% |
| Immigrants | Australia | 67.4 /100 | #159 | Good 2.9% |
| Immigrants | Fiji | 67.1 /100 | #160 | Good 2.9% |
| Albanians | 66.6 /100 | #161 | Good 2.9% |