Pima vs Immigrants from Kuwait Hearing Disability
COMPARE
Pima
Immigrants from Kuwait
Hearing Disability
Hearing Disability Comparison
Pima
Immigrants from Kuwait
3.7%
HEARING DISABILITY
0.0/ 100
METRIC RATING
296th/ 347
METRIC RANK
2.8%
HEARING DISABILITY
96.3/ 100
METRIC RATING
93rd/ 347
METRIC RANK
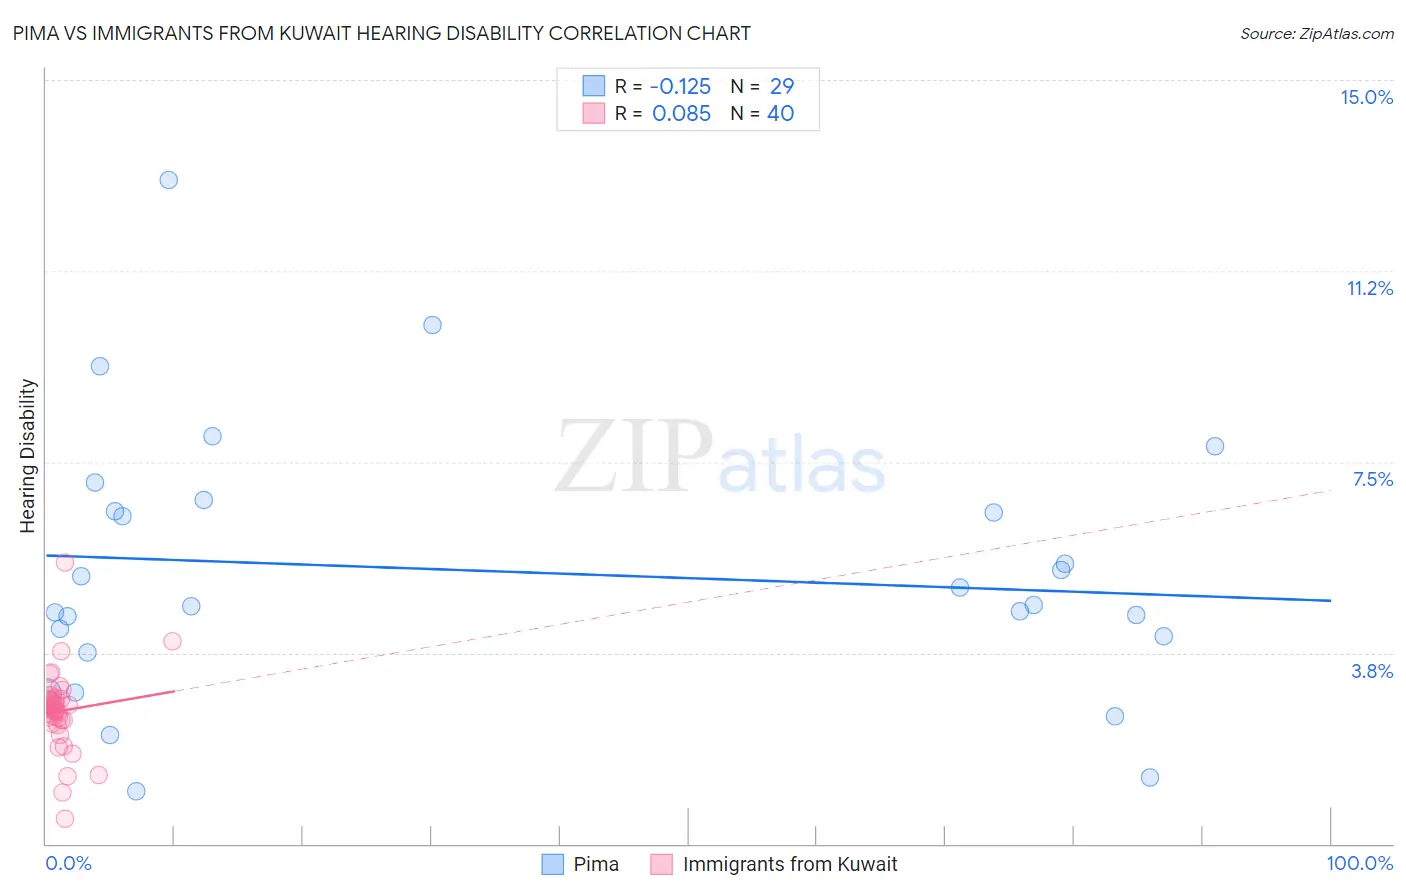
Pima vs Immigrants from Kuwait Hearing Disability Correlation Chart
The statistical analysis conducted on geographies consisting of 61,536,530 people shows a poor negative correlation between the proportion of Pima and percentage of population with hearing disability in the United States with a correlation coefficient (R) of -0.125 and weighted average of 3.7%. Similarly, the statistical analysis conducted on geographies consisting of 136,905,623 people shows a slight positive correlation between the proportion of Immigrants from Kuwait and percentage of population with hearing disability in the United States with a correlation coefficient (R) of 0.085 and weighted average of 2.8%, a difference of 34.2%.
Hearing Disability Correlation Summary
| Measurement | Pima | Immigrants from Kuwait |
| Minimum | 1.0% | 0.48% |
| Maximum | 13.0% | 5.5% |
| Range | 12.0% | 5.0% |
| Mean | 5.4% | 2.6% |
| Median | 4.7% | 2.7% |
| Interquartile 25% (IQ1) | 3.9% | 2.4% |
| Interquartile 75% (IQ3) | 6.6% | 2.9% |
| Interquartile Range (IQR) | 2.7% | 0.46% |
| Standard Deviation (Sample) | 2.6% | 0.82% |
| Standard Deviation (Population) | 2.6% | 0.81% |
Similar Demographics by Hearing Disability
Demographics Similar to Pima by Hearing Disability
In terms of hearing disability, the demographic groups most similar to Pima are Immigrants from the Azores (3.7%, a difference of 0.070%), Welsh (3.7%, a difference of 0.13%), Celtic (3.7%, a difference of 0.26%), Iroquois (3.7%, a difference of 0.39%), and German (3.7%, a difference of 0.54%).
| Demographics | Rating | Rank | Hearing Disability |
| Chinese | 0.0 /100 | #289 | Tragic 3.7% |
| Whites/Caucasians | 0.0 /100 | #290 | Tragic 3.7% |
| Finns | 0.0 /100 | #291 | Tragic 3.7% |
| Native Hawaiians | 0.0 /100 | #292 | Tragic 3.7% |
| Norwegians | 0.0 /100 | #293 | Tragic 3.7% |
| Iroquois | 0.0 /100 | #294 | Tragic 3.7% |
| Welsh | 0.0 /100 | #295 | Tragic 3.7% |
| Pima | 0.0 /100 | #296 | Tragic 3.7% |
| Immigrants | Azores | 0.0 /100 | #297 | Tragic 3.7% |
| Celtics | 0.0 /100 | #298 | Tragic 3.7% |
| Germans | 0.0 /100 | #299 | Tragic 3.7% |
| Scottish | 0.0 /100 | #300 | Tragic 3.7% |
| Pennsylvania Germans | 0.0 /100 | #301 | Tragic 3.7% |
| Dutch | 0.0 /100 | #302 | Tragic 3.7% |
| Menominee | 0.0 /100 | #303 | Tragic 3.7% |
Demographics Similar to Immigrants from Kuwait by Hearing Disability
In terms of hearing disability, the demographic groups most similar to Immigrants from Kuwait are Iranian (2.8%, a difference of 0.12%), Immigrants from Middle Africa (2.8%, a difference of 0.15%), Immigrants from Morocco (2.8%, a difference of 0.23%), Belizean (2.8%, a difference of 0.26%), and Uruguayan (2.8%, a difference of 0.27%).
| Demographics | Rating | Rank | Hearing Disability |
| Immigrants | Iran | 96.8 /100 | #86 | Exceptional 2.8% |
| Somalis | 96.7 /100 | #87 | Exceptional 2.8% |
| Immigrants | Turkey | 96.7 /100 | #88 | Exceptional 2.8% |
| Belizeans | 96.6 /100 | #89 | Exceptional 2.8% |
| Immigrants | Morocco | 96.6 /100 | #90 | Exceptional 2.8% |
| Immigrants | Middle Africa | 96.5 /100 | #91 | Exceptional 2.8% |
| Iranians | 96.4 /100 | #92 | Exceptional 2.8% |
| Immigrants | Kuwait | 96.3 /100 | #93 | Exceptional 2.8% |
| Uruguayans | 95.9 /100 | #94 | Exceptional 2.8% |
| Israelis | 95.9 /100 | #95 | Exceptional 2.8% |
| Immigrants | Somalia | 95.5 /100 | #96 | Exceptional 2.8% |
| Immigrants | Afghanistan | 95.3 /100 | #97 | Exceptional 2.8% |
| Immigrants | Honduras | 95.1 /100 | #98 | Exceptional 2.8% |
| Immigrants | Guatemala | 95.1 /100 | #99 | Exceptional 2.8% |
| Immigrants | Eastern Africa | 95.0 /100 | #100 | Exceptional 2.8% |