Pima vs Guamanian/Chamorro Disability Age 65 to 74
COMPARE
Pima
Guamanian/Chamorro
Disability Age 65 to 74
Disability Age 65 to 74 Comparison
Pima
Guamanians/Chamorros
38.6%
DISABILITY AGE 65 TO 74
0.0/ 100
METRIC RATING
347th/ 347
METRIC RANK
25.3%
DISABILITY AGE 65 TO 74
0.3/ 100
METRIC RATING
257th/ 347
METRIC RANK
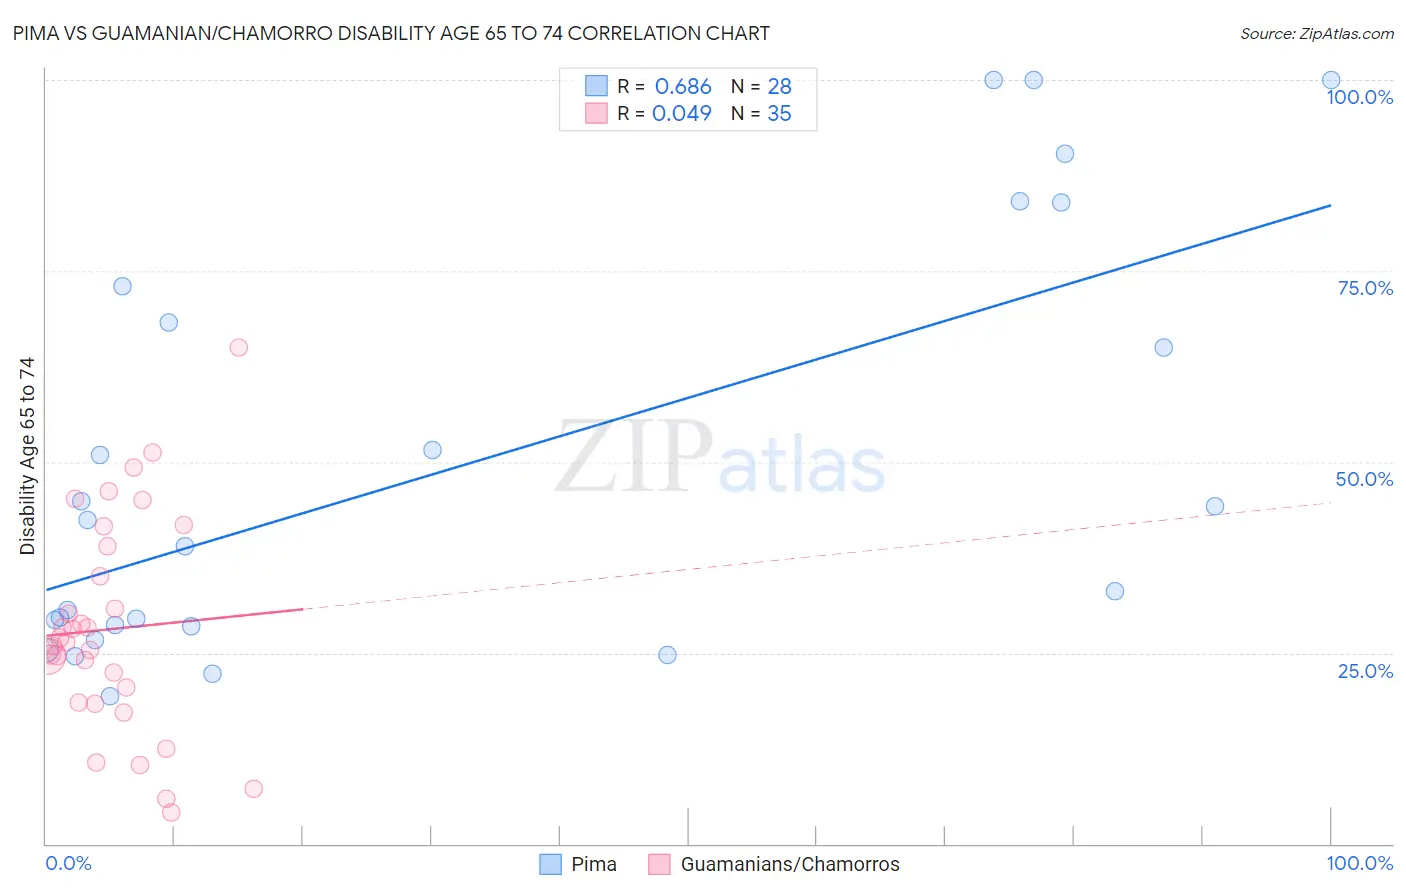
Pima vs Guamanian/Chamorro Disability Age 65 to 74 Correlation Chart
The statistical analysis conducted on geographies consisting of 61,525,025 people shows a significant positive correlation between the proportion of Pima and percentage of population with a disability between the ages 65 and 75 in the United States with a correlation coefficient (R) of 0.686 and weighted average of 38.6%. Similarly, the statistical analysis conducted on geographies consisting of 221,467,649 people shows no correlation between the proportion of Guamanians/Chamorros and percentage of population with a disability between the ages 65 and 75 in the United States with a correlation coefficient (R) of 0.049 and weighted average of 25.3%, a difference of 52.7%.
Disability Age 65 to 74 Correlation Summary
| Measurement | Pima | Guamanian/Chamorro |
| Minimum | 19.4% | 4.2% |
| Maximum | 100.0% | 65.0% |
| Range | 80.6% | 60.8% |
| Mean | 49.6% | 28.1% |
| Median | 40.6% | 26.4% |
| Interquartile 25% (IQ1) | 28.5% | 18.5% |
| Interquartile 75% (IQ3) | 70.6% | 39.0% |
| Interquartile Range (IQR) | 42.1% | 20.5% |
| Standard Deviation (Sample) | 27.1% | 14.0% |
| Standard Deviation (Population) | 26.6% | 13.8% |
Similar Demographics by Disability Age 65 to 74
Demographics Similar to Pima by Disability Age 65 to 74
In terms of disability age 65 to 74, the demographic groups most similar to Pima are Yup'ik (37.8%, a difference of 2.0%), Tohono O'odham (36.0%, a difference of 7.1%), Inupiat (34.5%, a difference of 11.8%), Navajo (33.3%, a difference of 15.8%), and Pueblo (33.1%, a difference of 16.7%).
| Demographics | Rating | Rank | Disability Age 65 to 74 |
| Colville | 0.0 /100 | #333 | Tragic 30.5% |
| Alaska Natives | 0.0 /100 | #334 | Tragic 30.6% |
| Cheyenne | 0.0 /100 | #335 | Tragic 31.1% |
| Yuman | 0.0 /100 | #336 | Tragic 31.5% |
| Houma | 0.0 /100 | #337 | Tragic 32.3% |
| Alaskan Athabascans | 0.0 /100 | #338 | Tragic 32.4% |
| Kiowa | 0.0 /100 | #339 | Tragic 32.6% |
| Lumbee | 0.0 /100 | #340 | Tragic 32.7% |
| Tsimshian | 0.0 /100 | #341 | Tragic 32.9% |
| Pueblo | 0.0 /100 | #342 | Tragic 33.1% |
| Navajo | 0.0 /100 | #343 | Tragic 33.3% |
| Inupiat | 0.0 /100 | #344 | Tragic 34.5% |
| Tohono O'odham | 0.0 /100 | #345 | Tragic 36.0% |
| Yup'ik | 0.0 /100 | #346 | Tragic 37.8% |
| Pima | 0.0 /100 | #347 | Tragic 38.6% |
Demographics Similar to Guamanians/Chamorros by Disability Age 65 to 74
In terms of disability age 65 to 74, the demographic groups most similar to Guamanians/Chamorros are Marshallese (25.3%, a difference of 0.060%), Immigrants from Cambodia (25.3%, a difference of 0.15%), Immigrants from Somalia (25.2%, a difference of 0.17%), Malaysian (25.4%, a difference of 0.47%), and Cape Verdean (25.4%, a difference of 0.55%).
| Demographics | Rating | Rank | Disability Age 65 to 74 |
| Salvadorans | 0.8 /100 | #250 | Tragic 25.0% |
| Immigrants | Nonimmigrants | 0.7 /100 | #251 | Tragic 25.0% |
| Immigrants | El Salvador | 0.6 /100 | #252 | Tragic 25.1% |
| Sub-Saharan Africans | 0.6 /100 | #253 | Tragic 25.1% |
| Somalis | 0.6 /100 | #254 | Tragic 25.1% |
| Central Americans | 0.5 /100 | #255 | Tragic 25.1% |
| Immigrants | Somalia | 0.4 /100 | #256 | Tragic 25.2% |
| Guamanians/Chamorros | 0.3 /100 | #257 | Tragic 25.3% |
| Marshallese | 0.3 /100 | #258 | Tragic 25.3% |
| Immigrants | Cambodia | 0.3 /100 | #259 | Tragic 25.3% |
| Malaysians | 0.2 /100 | #260 | Tragic 25.4% |
| Cape Verdeans | 0.2 /100 | #261 | Tragic 25.4% |
| Samoans | 0.2 /100 | #262 | Tragic 25.4% |
| Iroquois | 0.2 /100 | #263 | Tragic 25.4% |
| Hawaiians | 0.2 /100 | #264 | Tragic 25.5% |