Pima vs Alaskan Athabascan Disability Age 65 to 74
COMPARE
Pima
Alaskan Athabascan
Disability Age 65 to 74
Disability Age 65 to 74 Comparison
Pima
Alaskan Athabascans
38.6%
DISABILITY AGE 65 TO 74
0.0/ 100
METRIC RATING
347th/ 347
METRIC RANK
32.4%
DISABILITY AGE 65 TO 74
0.0/ 100
METRIC RATING
338th/ 347
METRIC RANK
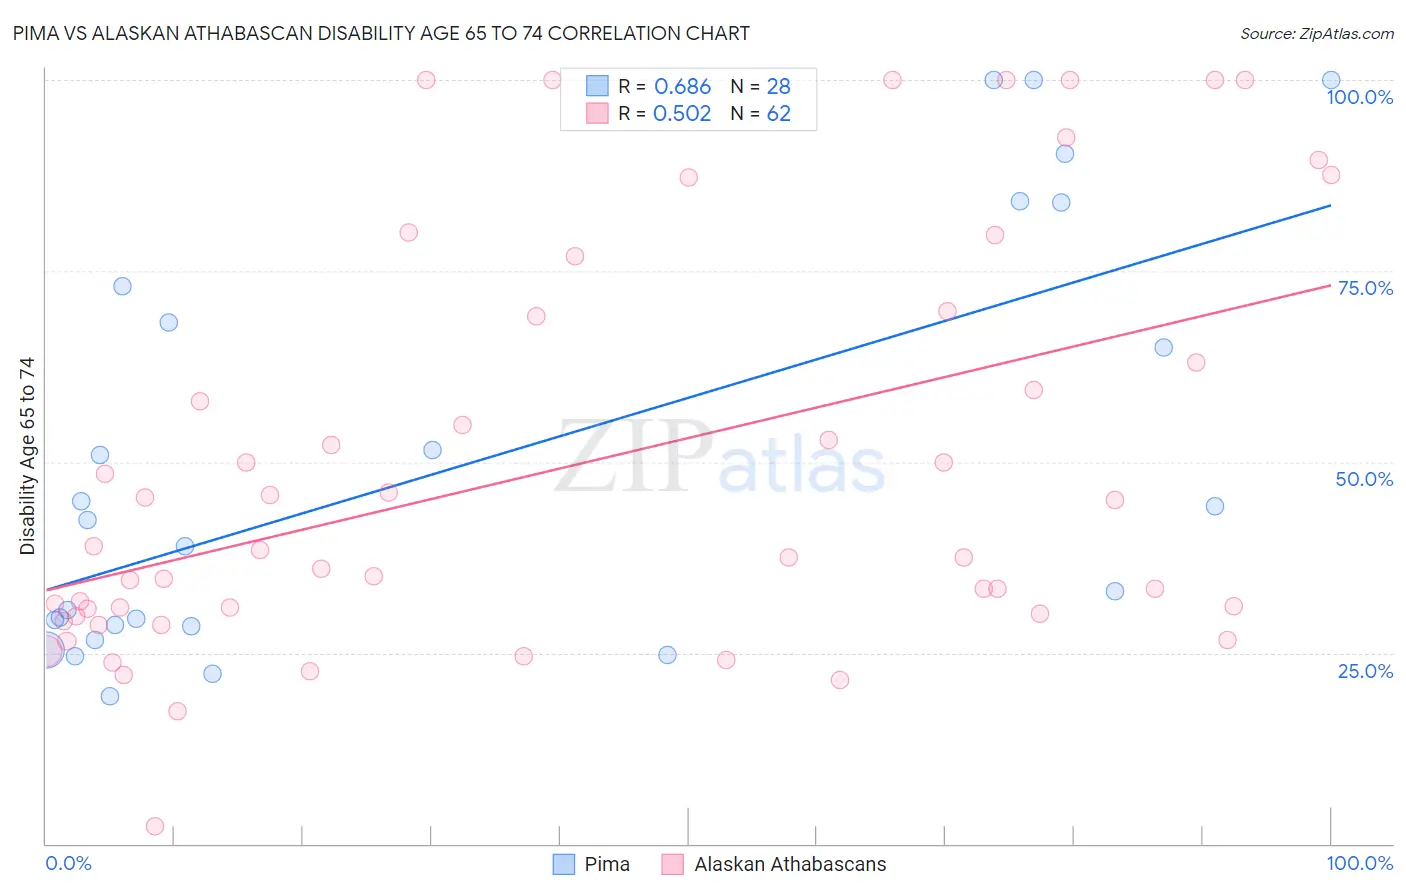
Pima vs Alaskan Athabascan Disability Age 65 to 74 Correlation Chart
The statistical analysis conducted on geographies consisting of 61,525,025 people shows a significant positive correlation between the proportion of Pima and percentage of population with a disability between the ages 65 and 75 in the United States with a correlation coefficient (R) of 0.686 and weighted average of 38.6%. Similarly, the statistical analysis conducted on geographies consisting of 45,797,821 people shows a substantial positive correlation between the proportion of Alaskan Athabascans and percentage of population with a disability between the ages 65 and 75 in the United States with a correlation coefficient (R) of 0.502 and weighted average of 32.4%, a difference of 19.3%.
Disability Age 65 to 74 Correlation Summary
| Measurement | Pima | Alaskan Athabascan |
| Minimum | 19.4% | 2.3% |
| Maximum | 100.0% | 100.0% |
| Range | 80.6% | 97.7% |
| Mean | 49.6% | 49.4% |
| Median | 40.6% | 38.0% |
| Interquartile 25% (IQ1) | 28.5% | 30.1% |
| Interquartile 75% (IQ3) | 70.6% | 69.1% |
| Interquartile Range (IQR) | 42.1% | 39.0% |
| Standard Deviation (Sample) | 27.1% | 26.6% |
| Standard Deviation (Population) | 26.6% | 26.4% |
Demographics Similar to Pima and Alaskan Athabascans by Disability Age 65 to 74
In terms of disability age 65 to 74, the demographic groups most similar to Pima are Yup'ik (37.8%, a difference of 2.0%), Tohono O'odham (36.0%, a difference of 7.1%), Inupiat (34.5%, a difference of 11.8%), Navajo (33.3%, a difference of 15.8%), and Pueblo (33.1%, a difference of 16.7%). Similarly, the demographic groups most similar to Alaskan Athabascans are Houma (32.3%, a difference of 0.19%), Kiowa (32.6%, a difference of 0.62%), Lumbee (32.7%, a difference of 1.1%), Tsimshian (32.9%, a difference of 1.7%), and Pueblo (33.1%, a difference of 2.3%).
| Demographics | Rating | Rank | Disability Age 65 to 74 |
| Hopi | 0.0 /100 | #328 | Tragic 30.0% |
| Choctaw | 0.0 /100 | #329 | Tragic 30.2% |
| Creek | 0.0 /100 | #330 | Tragic 30.2% |
| Chickasaw | 0.0 /100 | #331 | Tragic 30.2% |
| Natives/Alaskans | 0.0 /100 | #332 | Tragic 30.4% |
| Colville | 0.0 /100 | #333 | Tragic 30.5% |
| Alaska Natives | 0.0 /100 | #334 | Tragic 30.6% |
| Cheyenne | 0.0 /100 | #335 | Tragic 31.1% |
| Yuman | 0.0 /100 | #336 | Tragic 31.5% |
| Houma | 0.0 /100 | #337 | Tragic 32.3% |
| Alaskan Athabascans | 0.0 /100 | #338 | Tragic 32.4% |
| Kiowa | 0.0 /100 | #339 | Tragic 32.6% |
| Lumbee | 0.0 /100 | #340 | Tragic 32.7% |
| Tsimshian | 0.0 /100 | #341 | Tragic 32.9% |
| Pueblo | 0.0 /100 | #342 | Tragic 33.1% |
| Navajo | 0.0 /100 | #343 | Tragic 33.3% |
| Inupiat | 0.0 /100 | #344 | Tragic 34.5% |
| Tohono O'odham | 0.0 /100 | #345 | Tragic 36.0% |
| Yup'ik | 0.0 /100 | #346 | Tragic 37.8% |
| Pima | 0.0 /100 | #347 | Tragic 38.6% |