Comanche vs Guamanian/Chamorro Disability Age 65 to 74
COMPARE
Comanche
Guamanian/Chamorro
Disability Age 65 to 74
Disability Age 65 to 74 Comparison
Comanche
Guamanians/Chamorros
28.3%
DISABILITY AGE 65 TO 74
0.0/ 100
METRIC RATING
321st/ 347
METRIC RANK
25.3%
DISABILITY AGE 65 TO 74
0.3/ 100
METRIC RATING
257th/ 347
METRIC RANK
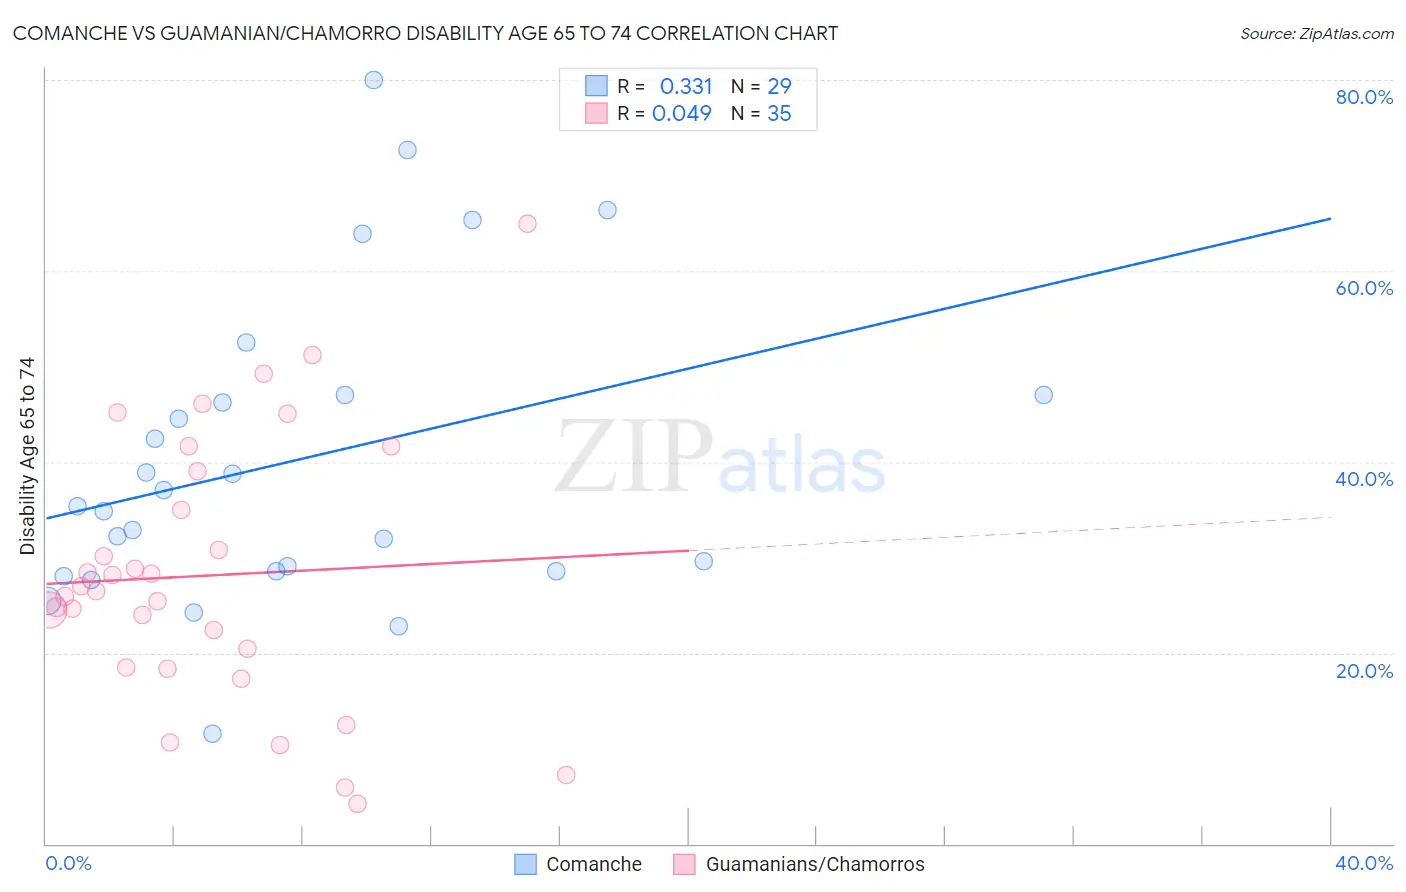
Comanche vs Guamanian/Chamorro Disability Age 65 to 74 Correlation Chart
The statistical analysis conducted on geographies consisting of 109,698,765 people shows a mild positive correlation between the proportion of Comanche and percentage of population with a disability between the ages 65 and 75 in the United States with a correlation coefficient (R) of 0.331 and weighted average of 28.3%. Similarly, the statistical analysis conducted on geographies consisting of 221,467,649 people shows no correlation between the proportion of Guamanians/Chamorros and percentage of population with a disability between the ages 65 and 75 in the United States with a correlation coefficient (R) of 0.049 and weighted average of 25.3%, a difference of 12.1%.
Disability Age 65 to 74 Correlation Summary
| Measurement | Comanche | Guamanian/Chamorro |
| Minimum | 11.6% | 4.2% |
| Maximum | 80.0% | 65.0% |
| Range | 68.4% | 60.8% |
| Mean | 40.2% | 28.1% |
| Median | 35.3% | 26.4% |
| Interquartile 25% (IQ1) | 28.6% | 18.5% |
| Interquartile 75% (IQ3) | 47.1% | 39.0% |
| Interquartile Range (IQR) | 18.5% | 20.5% |
| Standard Deviation (Sample) | 16.3% | 14.0% |
| Standard Deviation (Population) | 16.1% | 13.8% |
Similar Demographics by Disability Age 65 to 74
Demographics Similar to Comanche by Disability Age 65 to 74
In terms of disability age 65 to 74, the demographic groups most similar to Comanche are Aleut (28.4%, a difference of 0.33%), Cherokee (28.2%, a difference of 0.51%), Arapaho (28.1%, a difference of 0.89%), Nepalese (28.0%, a difference of 1.1%), and Immigrants from Armenia (28.0%, a difference of 1.3%).
| Demographics | Rating | Rank | Disability Age 65 to 74 |
| Chippewa | 0.0 /100 | #314 | Tragic 27.8% |
| Cajuns | 0.0 /100 | #315 | Tragic 27.9% |
| Crow | 0.0 /100 | #316 | Tragic 27.9% |
| Immigrants | Armenia | 0.0 /100 | #317 | Tragic 28.0% |
| Nepalese | 0.0 /100 | #318 | Tragic 28.0% |
| Arapaho | 0.0 /100 | #319 | Tragic 28.1% |
| Cherokee | 0.0 /100 | #320 | Tragic 28.2% |
| Comanche | 0.0 /100 | #321 | Tragic 28.3% |
| Aleuts | 0.0 /100 | #322 | Tragic 28.4% |
| Puerto Ricans | 0.0 /100 | #323 | Tragic 29.1% |
| Seminole | 0.0 /100 | #324 | Tragic 29.4% |
| Dutch West Indians | 0.0 /100 | #325 | Tragic 29.6% |
| Yakama | 0.0 /100 | #326 | Tragic 29.6% |
| Apache | 0.0 /100 | #327 | Tragic 29.7% |
| Hopi | 0.0 /100 | #328 | Tragic 30.0% |
Demographics Similar to Guamanians/Chamorros by Disability Age 65 to 74
In terms of disability age 65 to 74, the demographic groups most similar to Guamanians/Chamorros are Marshallese (25.3%, a difference of 0.060%), Immigrants from Cambodia (25.3%, a difference of 0.15%), Immigrants from Somalia (25.2%, a difference of 0.17%), Malaysian (25.4%, a difference of 0.47%), and Cape Verdean (25.4%, a difference of 0.55%).
| Demographics | Rating | Rank | Disability Age 65 to 74 |
| Salvadorans | 0.8 /100 | #250 | Tragic 25.0% |
| Immigrants | Nonimmigrants | 0.7 /100 | #251 | Tragic 25.0% |
| Immigrants | El Salvador | 0.6 /100 | #252 | Tragic 25.1% |
| Sub-Saharan Africans | 0.6 /100 | #253 | Tragic 25.1% |
| Somalis | 0.6 /100 | #254 | Tragic 25.1% |
| Central Americans | 0.5 /100 | #255 | Tragic 25.1% |
| Immigrants | Somalia | 0.4 /100 | #256 | Tragic 25.2% |
| Guamanians/Chamorros | 0.3 /100 | #257 | Tragic 25.3% |
| Marshallese | 0.3 /100 | #258 | Tragic 25.3% |
| Immigrants | Cambodia | 0.3 /100 | #259 | Tragic 25.3% |
| Malaysians | 0.2 /100 | #260 | Tragic 25.4% |
| Cape Verdeans | 0.2 /100 | #261 | Tragic 25.4% |
| Samoans | 0.2 /100 | #262 | Tragic 25.4% |
| Iroquois | 0.2 /100 | #263 | Tragic 25.4% |
| Hawaiians | 0.2 /100 | #264 | Tragic 25.5% |