Pima vs Guamanian/Chamorro Seniors Poverty Over the Age of 75
COMPARE
Pima
Guamanian/Chamorro
Seniors Poverty Over the Age of 75
Seniors Poverty Over the Age of 75 Comparison
Pima
Guamanians/Chamorros
23.9%
SENIORS POVERTY OVER THE AGE OF 75
0.0/ 100
METRIC RATING
347th/ 347
METRIC RANK
11.6%
SENIORS POVERTY OVER THE AGE OF 75
90.6/ 100
METRIC RATING
102nd/ 347
METRIC RANK
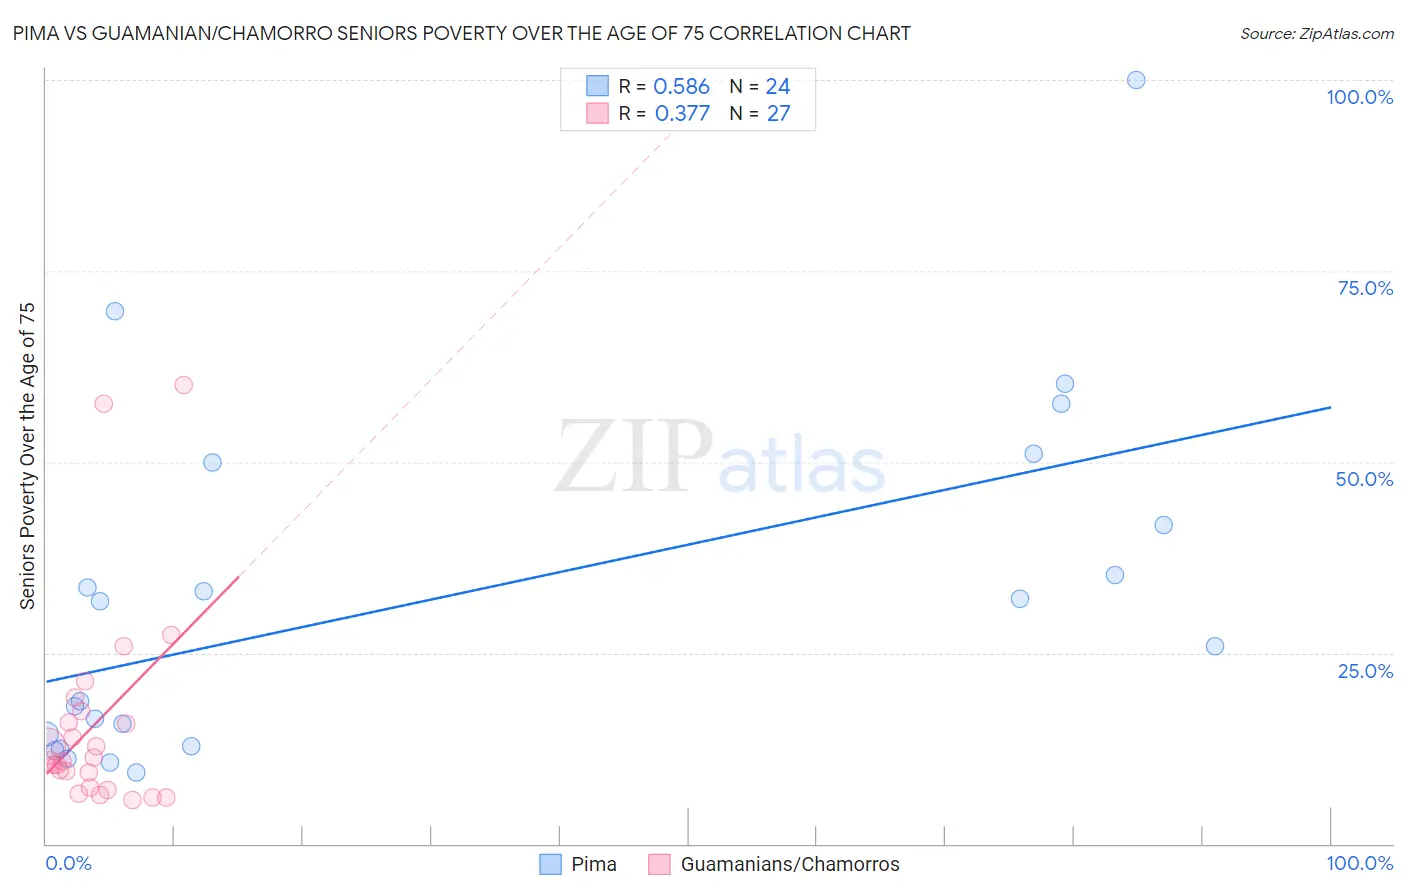
Pima vs Guamanian/Chamorro Seniors Poverty Over the Age of 75 Correlation Chart
The statistical analysis conducted on geographies consisting of 61,445,536 people shows a substantial positive correlation between the proportion of Pima and poverty level among seniors over the age of 75 in the United States with a correlation coefficient (R) of 0.586 and weighted average of 23.9%. Similarly, the statistical analysis conducted on geographies consisting of 220,212,550 people shows a mild positive correlation between the proportion of Guamanians/Chamorros and poverty level among seniors over the age of 75 in the United States with a correlation coefficient (R) of 0.377 and weighted average of 11.6%, a difference of 105.4%.
Seniors Poverty Over the Age of 75 Correlation Summary
| Measurement | Pima | Guamanian/Chamorro |
| Minimum | 9.4% | 5.7% |
| Maximum | 100.0% | 60.0% |
| Range | 90.6% | 54.3% |
| Mean | 32.2% | 15.8% |
| Median | 28.8% | 10.8% |
| Interquartile 25% (IQ1) | 13.6% | 7.4% |
| Interquartile 75% (IQ3) | 45.8% | 17.3% |
| Interquartile Range (IQR) | 32.3% | 9.9% |
| Standard Deviation (Sample) | 22.9% | 13.7% |
| Standard Deviation (Population) | 22.4% | 13.4% |
Similar Demographics by Seniors Poverty Over the Age of 75
Demographics Similar to Pima by Seniors Poverty Over the Age of 75
In terms of seniors poverty over the age of 75, the demographic groups most similar to Pima are Puerto Rican (23.2%, a difference of 2.9%), Immigrants from Dominican Republic (20.1%, a difference of 19.1%), Immigrants from Cuba (19.9%, a difference of 20.0%), Lumbee (19.7%, a difference of 20.9%), and Dominican (19.6%, a difference of 21.7%).
| Demographics | Rating | Rank | Seniors Poverty Over the Age of 75 |
| Immigrants | Nicaragua | 0.0 /100 | #333 | Tragic 17.6% |
| Immigrants | Grenada | 0.0 /100 | #334 | Tragic 17.8% |
| Cubans | 0.0 /100 | #335 | Tragic 18.0% |
| Immigrants | Caribbean | 0.0 /100 | #336 | Tragic 18.2% |
| Yakama | 0.0 /100 | #337 | Tragic 18.3% |
| Immigrants | Cabo Verde | 0.0 /100 | #338 | Tragic 18.5% |
| Hopi | 0.0 /100 | #339 | Tragic 18.9% |
| Tohono O'odham | 0.0 /100 | #340 | Tragic 19.1% |
| Navajo | 0.0 /100 | #341 | Tragic 19.4% |
| Dominicans | 0.0 /100 | #342 | Tragic 19.6% |
| Lumbee | 0.0 /100 | #343 | Tragic 19.7% |
| Immigrants | Cuba | 0.0 /100 | #344 | Tragic 19.9% |
| Immigrants | Dominican Republic | 0.0 /100 | #345 | Tragic 20.1% |
| Puerto Ricans | 0.0 /100 | #346 | Tragic 23.2% |
| Pima | 0.0 /100 | #347 | Tragic 23.9% |
Demographics Similar to Guamanians/Chamorros by Seniors Poverty Over the Age of 75
In terms of seniors poverty over the age of 75, the demographic groups most similar to Guamanians/Chamorros are Jordanian (11.6%, a difference of 0.040%), Immigrants from Kuwait (11.6%, a difference of 0.040%), Immigrants from Singapore (11.6%, a difference of 0.090%), Chickasaw (11.6%, a difference of 0.10%), and Syrian (11.6%, a difference of 0.12%).
| Demographics | Rating | Rank | Seniors Poverty Over the Age of 75 |
| Immigrants | Bosnia and Herzegovina | 92.6 /100 | #95 | Exceptional 11.6% |
| Immigrants | Sweden | 92.6 /100 | #96 | Exceptional 11.6% |
| Romanians | 92.3 /100 | #97 | Exceptional 11.6% |
| Immigrants | Japan | 91.9 /100 | #98 | Exceptional 11.6% |
| Immigrants | Ethiopia | 91.7 /100 | #99 | Exceptional 11.6% |
| Syrians | 91.1 /100 | #100 | Exceptional 11.6% |
| Jordanians | 90.8 /100 | #101 | Exceptional 11.6% |
| Guamanians/Chamorros | 90.6 /100 | #102 | Exceptional 11.6% |
| Immigrants | Kuwait | 90.5 /100 | #103 | Exceptional 11.6% |
| Immigrants | Singapore | 90.3 /100 | #104 | Exceptional 11.6% |
| Chickasaw | 90.2 /100 | #105 | Exceptional 11.6% |
| Russians | 89.9 /100 | #106 | Excellent 11.6% |
| Immigrants | Oceania | 89.4 /100 | #107 | Excellent 11.7% |
| Turks | 89.4 /100 | #108 | Excellent 11.7% |
| South Africans | 89.3 /100 | #109 | Excellent 11.7% |