Pima vs Guamanian/Chamorro Cognitive Disability
COMPARE
Pima
Guamanian/Chamorro
Cognitive Disability
Cognitive Disability Comparison
Pima
Guamanians/Chamorros
18.8%
COGNITIVE DISABILITY
0.0/ 100
METRIC RATING
331st/ 347
METRIC RANK
17.9%
COGNITIVE DISABILITY
0.5/ 100
METRIC RATING
261st/ 347
METRIC RANK
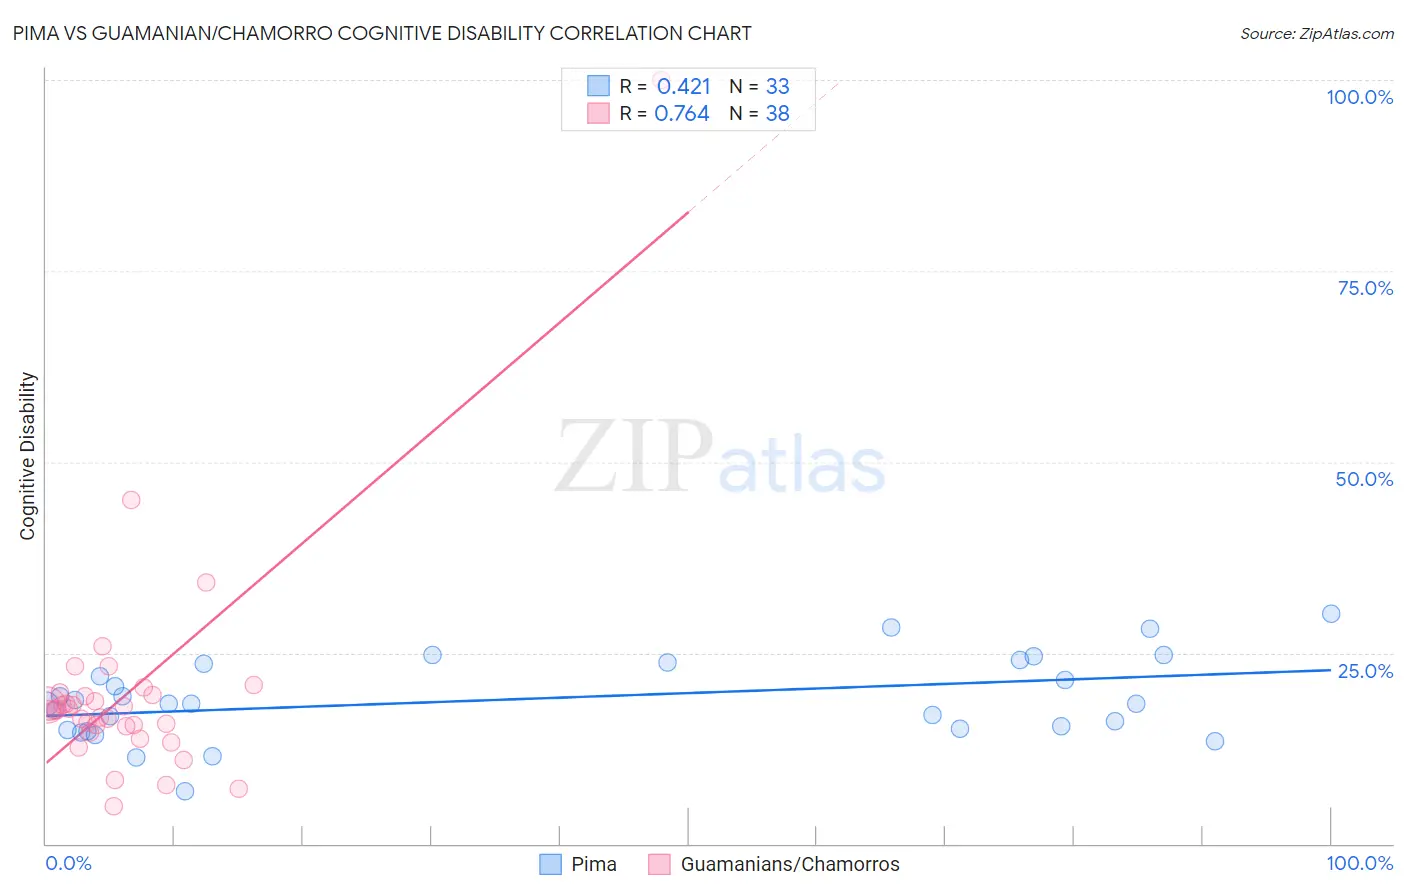
Pima vs Guamanian/Chamorro Cognitive Disability Correlation Chart
The statistical analysis conducted on geographies consisting of 61,542,171 people shows a moderate positive correlation between the proportion of Pima and percentage of population with cognitive disability in the United States with a correlation coefficient (R) of 0.421 and weighted average of 18.8%. Similarly, the statistical analysis conducted on geographies consisting of 221,888,944 people shows a strong positive correlation between the proportion of Guamanians/Chamorros and percentage of population with cognitive disability in the United States with a correlation coefficient (R) of 0.764 and weighted average of 17.9%, a difference of 4.8%.
Cognitive Disability Correlation Summary
| Measurement | Pima | Guamanian/Chamorro |
| Minimum | 6.9% | 5.0% |
| Maximum | 30.2% | 100.0% |
| Range | 23.3% | 95.0% |
| Mean | 19.0% | 19.8% |
| Median | 18.4% | 17.5% |
| Interquartile 25% (IQ1) | 15.0% | 15.4% |
| Interquartile 75% (IQ3) | 23.6% | 19.5% |
| Interquartile Range (IQR) | 8.6% | 4.0% |
| Standard Deviation (Sample) | 5.3% | 15.1% |
| Standard Deviation (Population) | 5.2% | 14.9% |
Similar Demographics by Cognitive Disability
Demographics Similar to Pima by Cognitive Disability
In terms of cognitive disability, the demographic groups most similar to Pima are Immigrants from Sudan (18.8%, a difference of 0.020%), Immigrants from Dominican Republic (18.8%, a difference of 0.070%), Immigrants from Yemen (18.8%, a difference of 0.070%), Navajo (18.8%, a difference of 0.16%), and Kiowa (18.7%, a difference of 0.39%).
| Demographics | Rating | Rank | Cognitive Disability |
| Dominicans | 0.0 /100 | #324 | Tragic 18.7% |
| Indonesians | 0.0 /100 | #325 | Tragic 18.7% |
| Immigrants | Senegal | 0.0 /100 | #326 | Tragic 18.7% |
| U.S. Virgin Islanders | 0.0 /100 | #327 | Tragic 18.7% |
| Kiowa | 0.0 /100 | #328 | Tragic 18.7% |
| Navajo | 0.0 /100 | #329 | Tragic 18.8% |
| Immigrants | Dominican Republic | 0.0 /100 | #330 | Tragic 18.8% |
| Pima | 0.0 /100 | #331 | Tragic 18.8% |
| Immigrants | Sudan | 0.0 /100 | #332 | Tragic 18.8% |
| Immigrants | Yemen | 0.0 /100 | #333 | Tragic 18.8% |
| Sudanese | 0.0 /100 | #334 | Tragic 18.9% |
| Senegalese | 0.0 /100 | #335 | Tragic 19.0% |
| Blacks/African Americans | 0.0 /100 | #336 | Tragic 19.0% |
| Immigrants | Saudi Arabia | 0.0 /100 | #337 | Tragic 19.1% |
| Lumbee | 0.0 /100 | #338 | Tragic 19.1% |
Demographics Similar to Guamanians/Chamorros by Cognitive Disability
In terms of cognitive disability, the demographic groups most similar to Guamanians/Chamorros are Sierra Leonean (17.9%, a difference of 0.030%), Immigrants from Belize (17.9%, a difference of 0.050%), Ethiopian (17.9%, a difference of 0.060%), Immigrants from Barbados (17.9%, a difference of 0.070%), and Menominee (18.0%, a difference of 0.13%).
| Demographics | Rating | Rank | Cognitive Disability |
| Hispanics or Latinos | 0.6 /100 | #254 | Tragic 17.9% |
| Immigrants | Azores | 0.6 /100 | #255 | Tragic 17.9% |
| Bahamians | 0.6 /100 | #256 | Tragic 17.9% |
| Mexican American Indians | 0.6 /100 | #257 | Tragic 17.9% |
| Immigrants | Armenia | 0.6 /100 | #258 | Tragic 17.9% |
| Ethiopians | 0.5 /100 | #259 | Tragic 17.9% |
| Immigrants | Belize | 0.5 /100 | #260 | Tragic 17.9% |
| Guamanians/Chamorros | 0.5 /100 | #261 | Tragic 17.9% |
| Sierra Leoneans | 0.4 /100 | #262 | Tragic 17.9% |
| Immigrants | Barbados | 0.4 /100 | #263 | Tragic 17.9% |
| Menominee | 0.4 /100 | #264 | Tragic 18.0% |
| Spanish Americans | 0.4 /100 | #265 | Tragic 18.0% |
| Belizeans | 0.4 /100 | #266 | Tragic 18.0% |
| Nepalese | 0.3 /100 | #267 | Tragic 18.0% |
| Cherokee | 0.3 /100 | #268 | Tragic 18.0% |