Immigrants from Fiji vs Guamanian/Chamorro Disability Age 65 to 74
COMPARE
Immigrants from Fiji
Guamanian/Chamorro
Disability Age 65 to 74
Disability Age 65 to 74 Comparison
Immigrants from Fiji
Guamanians/Chamorros
25.0%
DISABILITY AGE 65 TO 74
0.8/ 100
METRIC RATING
249th/ 347
METRIC RANK
25.3%
DISABILITY AGE 65 TO 74
0.3/ 100
METRIC RATING
257th/ 347
METRIC RANK
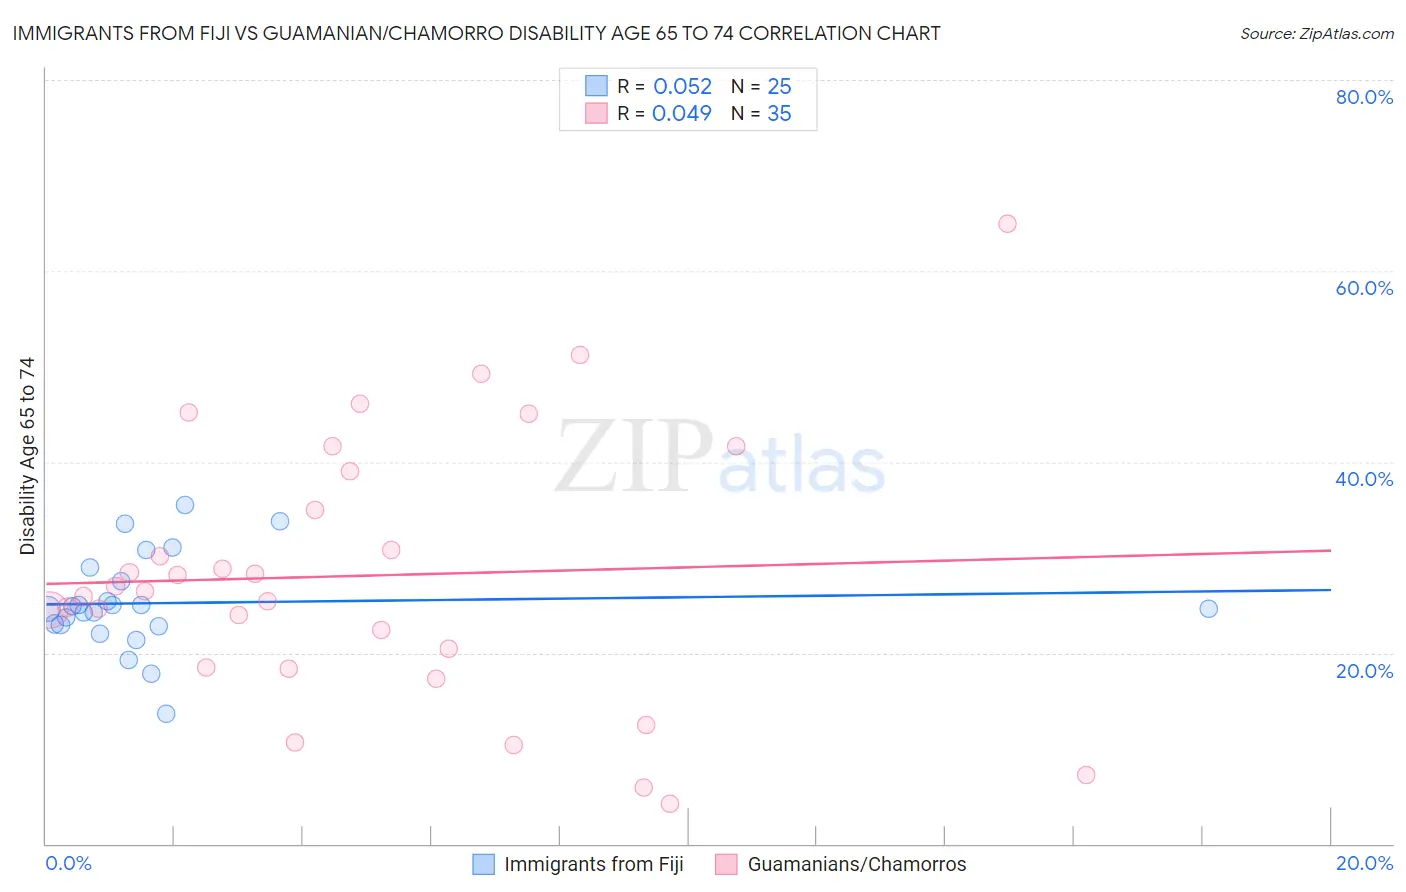
Immigrants from Fiji vs Guamanian/Chamorro Disability Age 65 to 74 Correlation Chart
The statistical analysis conducted on geographies consisting of 93,725,499 people shows a slight positive correlation between the proportion of Immigrants from Fiji and percentage of population with a disability between the ages 65 and 75 in the United States with a correlation coefficient (R) of 0.052 and weighted average of 25.0%. Similarly, the statistical analysis conducted on geographies consisting of 221,467,649 people shows no correlation between the proportion of Guamanians/Chamorros and percentage of population with a disability between the ages 65 and 75 in the United States with a correlation coefficient (R) of 0.049 and weighted average of 25.3%, a difference of 1.3%.
Disability Age 65 to 74 Correlation Summary
| Measurement | Immigrants from Fiji | Guamanian/Chamorro |
| Minimum | 13.6% | 4.2% |
| Maximum | 35.4% | 65.0% |
| Range | 21.9% | 60.8% |
| Mean | 25.2% | 28.1% |
| Median | 24.7% | 26.4% |
| Interquartile 25% (IQ1) | 22.9% | 18.5% |
| Interquartile 75% (IQ3) | 28.2% | 39.0% |
| Interquartile Range (IQR) | 5.3% | 20.5% |
| Standard Deviation (Sample) | 5.0% | 14.0% |
| Standard Deviation (Population) | 4.9% | 13.8% |
Demographics Similar to Immigrants from Fiji and Guamanians/Chamorros by Disability Age 65 to 74
In terms of disability age 65 to 74, the demographic groups most similar to Immigrants from Fiji are Salvadoran (25.0%, a difference of 0.020%), Senegalese (24.9%, a difference of 0.10%), Nonimmigrants (25.0%, a difference of 0.22%), Indonesian (24.9%, a difference of 0.36%), and Immigrants from El Salvador (25.1%, a difference of 0.41%). Similarly, the demographic groups most similar to Guamanians/Chamorros are Marshallese (25.3%, a difference of 0.060%), Immigrants from Cambodia (25.3%, a difference of 0.15%), Immigrants from Somalia (25.2%, a difference of 0.17%), Malaysian (25.4%, a difference of 0.47%), and Cape Verdean (25.4%, a difference of 0.55%).
| Demographics | Rating | Rank | Disability Age 65 to 74 |
| Spanish | 2.2 /100 | #243 | Tragic 24.6% |
| Armenians | 2.0 /100 | #244 | Tragic 24.7% |
| British West Indians | 2.0 /100 | #245 | Tragic 24.7% |
| Immigrants | Iraq | 1.9 /100 | #246 | Tragic 24.7% |
| Indonesians | 1.1 /100 | #247 | Tragic 24.9% |
| Senegalese | 0.9 /100 | #248 | Tragic 24.9% |
| Immigrants | Fiji | 0.8 /100 | #249 | Tragic 25.0% |
| Salvadorans | 0.8 /100 | #250 | Tragic 25.0% |
| Immigrants | Nonimmigrants | 0.7 /100 | #251 | Tragic 25.0% |
| Immigrants | El Salvador | 0.6 /100 | #252 | Tragic 25.1% |
| Sub-Saharan Africans | 0.6 /100 | #253 | Tragic 25.1% |
| Somalis | 0.6 /100 | #254 | Tragic 25.1% |
| Central Americans | 0.5 /100 | #255 | Tragic 25.1% |
| Immigrants | Somalia | 0.4 /100 | #256 | Tragic 25.2% |
| Guamanians/Chamorros | 0.3 /100 | #257 | Tragic 25.3% |
| Marshallese | 0.3 /100 | #258 | Tragic 25.3% |
| Immigrants | Cambodia | 0.3 /100 | #259 | Tragic 25.3% |
| Malaysians | 0.2 /100 | #260 | Tragic 25.4% |
| Cape Verdeans | 0.2 /100 | #261 | Tragic 25.4% |
| Samoans | 0.2 /100 | #262 | Tragic 25.4% |
| Iroquois | 0.2 /100 | #263 | Tragic 25.4% |