Estonian vs Bermudan Female Disability
COMPARE
Estonian
Bermudan
Female Disability
Female Disability Comparison
Estonians
Bermudans
12.0%
FEMALE DISABILITY
87.8/ 100
METRIC RATING
145th/ 347
METRIC RANK
12.7%
FEMALE DISABILITY
1.0/ 100
METRIC RATING
261st/ 347
METRIC RANK
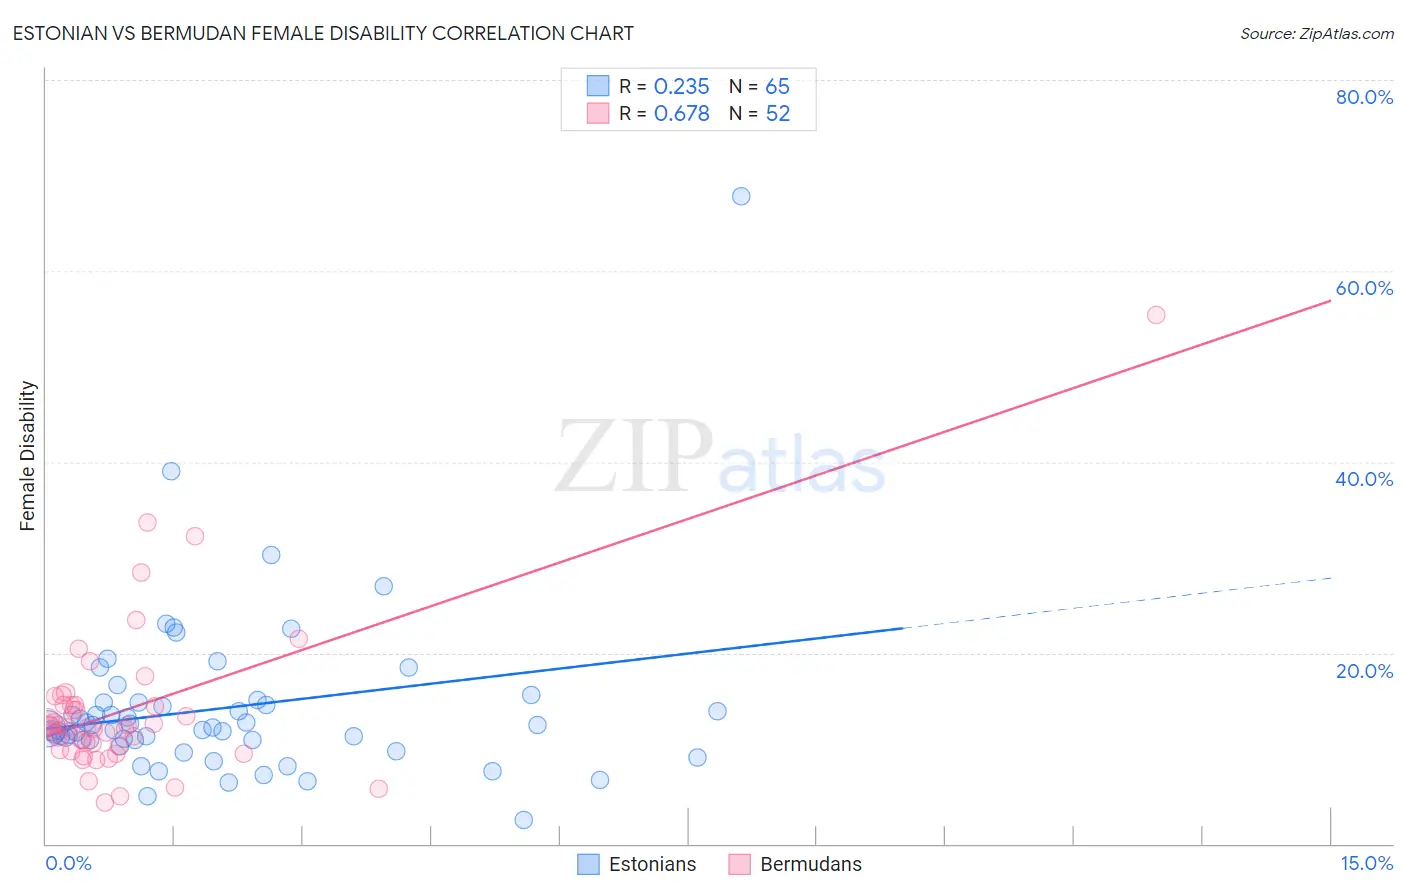
Estonian vs Bermudan Female Disability Correlation Chart
The statistical analysis conducted on geographies consisting of 123,526,359 people shows a weak positive correlation between the proportion of Estonians and percentage of females with a disability in the United States with a correlation coefficient (R) of 0.235 and weighted average of 12.0%. Similarly, the statistical analysis conducted on geographies consisting of 55,721,549 people shows a significant positive correlation between the proportion of Bermudans and percentage of females with a disability in the United States with a correlation coefficient (R) of 0.678 and weighted average of 12.7%, a difference of 6.3%.
Female Disability Correlation Summary
| Measurement | Estonian | Bermudan |
| Minimum | 2.4% | 4.4% |
| Maximum | 67.8% | 55.4% |
| Range | 65.4% | 51.1% |
| Mean | 14.2% | 14.1% |
| Median | 12.1% | 12.2% |
| Interquartile 25% (IQ1) | 10.8% | 10.1% |
| Interquartile 75% (IQ3) | 14.8% | 14.5% |
| Interquartile Range (IQR) | 3.9% | 4.5% |
| Standard Deviation (Sample) | 9.0% | 8.3% |
| Standard Deviation (Population) | 8.9% | 8.2% |
Similar Demographics by Female Disability
Demographics Similar to Estonians by Female Disability
In terms of female disability, the demographic groups most similar to Estonians are Immigrants from Austria (12.0%, a difference of 0.0%), Immigrants from Sudan (11.9%, a difference of 0.17%), Immigrants from Africa (11.9%, a difference of 0.21%), Pakistani (12.0%, a difference of 0.26%), and Nigerian (12.0%, a difference of 0.30%).
| Demographics | Rating | Rank | Female Disability |
| Ecuadorians | 93.4 /100 | #138 | Exceptional 11.9% |
| Immigrants | Hungary | 92.8 /100 | #139 | Exceptional 11.9% |
| Romanians | 91.6 /100 | #140 | Exceptional 11.9% |
| Immigrants | Ecuador | 91.5 /100 | #141 | Exceptional 11.9% |
| Immigrants | Africa | 90.0 /100 | #142 | Excellent 11.9% |
| Immigrants | Sudan | 89.6 /100 | #143 | Excellent 11.9% |
| Immigrants | Austria | 87.9 /100 | #144 | Excellent 12.0% |
| Estonians | 87.8 /100 | #145 | Excellent 12.0% |
| Pakistanis | 84.6 /100 | #146 | Excellent 12.0% |
| Nigerians | 84.0 /100 | #147 | Excellent 12.0% |
| Immigrants | Kenya | 83.1 /100 | #148 | Excellent 12.0% |
| Greeks | 82.0 /100 | #149 | Excellent 12.0% |
| Immigrants | Moldova | 81.4 /100 | #150 | Excellent 12.0% |
| Icelanders | 80.7 /100 | #151 | Excellent 12.0% |
| Immigrants | Scotland | 79.3 /100 | #152 | Good 12.0% |
Demographics Similar to Bermudans by Female Disability
In terms of female disability, the demographic groups most similar to Bermudans are Subsaharan African (12.7%, a difference of 0.040%), Immigrants from Armenia (12.7%, a difference of 0.050%), Czechoslovakian (12.7%, a difference of 0.070%), Liberian (12.7%, a difference of 0.14%), and Aleut (12.7%, a difference of 0.14%).
| Demographics | Rating | Rank | Female Disability |
| Hawaiians | 1.4 /100 | #254 | Tragic 12.7% |
| Immigrants | Germany | 1.3 /100 | #255 | Tragic 12.7% |
| British West Indians | 1.2 /100 | #256 | Tragic 12.7% |
| Liberians | 1.1 /100 | #257 | Tragic 12.7% |
| Aleuts | 1.1 /100 | #258 | Tragic 12.7% |
| Immigrants | Armenia | 1.0 /100 | #259 | Tragic 12.7% |
| Sub-Saharan Africans | 1.0 /100 | #260 | Tragic 12.7% |
| Bermudans | 1.0 /100 | #261 | Tragic 12.7% |
| Czechoslovakians | 0.9 /100 | #262 | Tragic 12.7% |
| Spaniards | 0.7 /100 | #263 | Tragic 12.8% |
| Alaska Natives | 0.6 /100 | #264 | Tragic 12.8% |
| West Indians | 0.5 /100 | #265 | Tragic 12.8% |
| Finns | 0.4 /100 | #266 | Tragic 12.8% |
| Senegalese | 0.4 /100 | #267 | Tragic 12.8% |
| Immigrants | Laos | 0.4 /100 | #268 | Tragic 12.8% |