Pima vs Bermudan 10th Grade
COMPARE
Pima
Bermudan
10th Grade
10th Grade Comparison
Pima
Bermudans
91.2%
10TH GRADE
0.0/ 100
METRIC RATING
304th/ 347
METRIC RANK
93.9%
10TH GRADE
71.0/ 100
METRIC RATING
158th/ 347
METRIC RANK
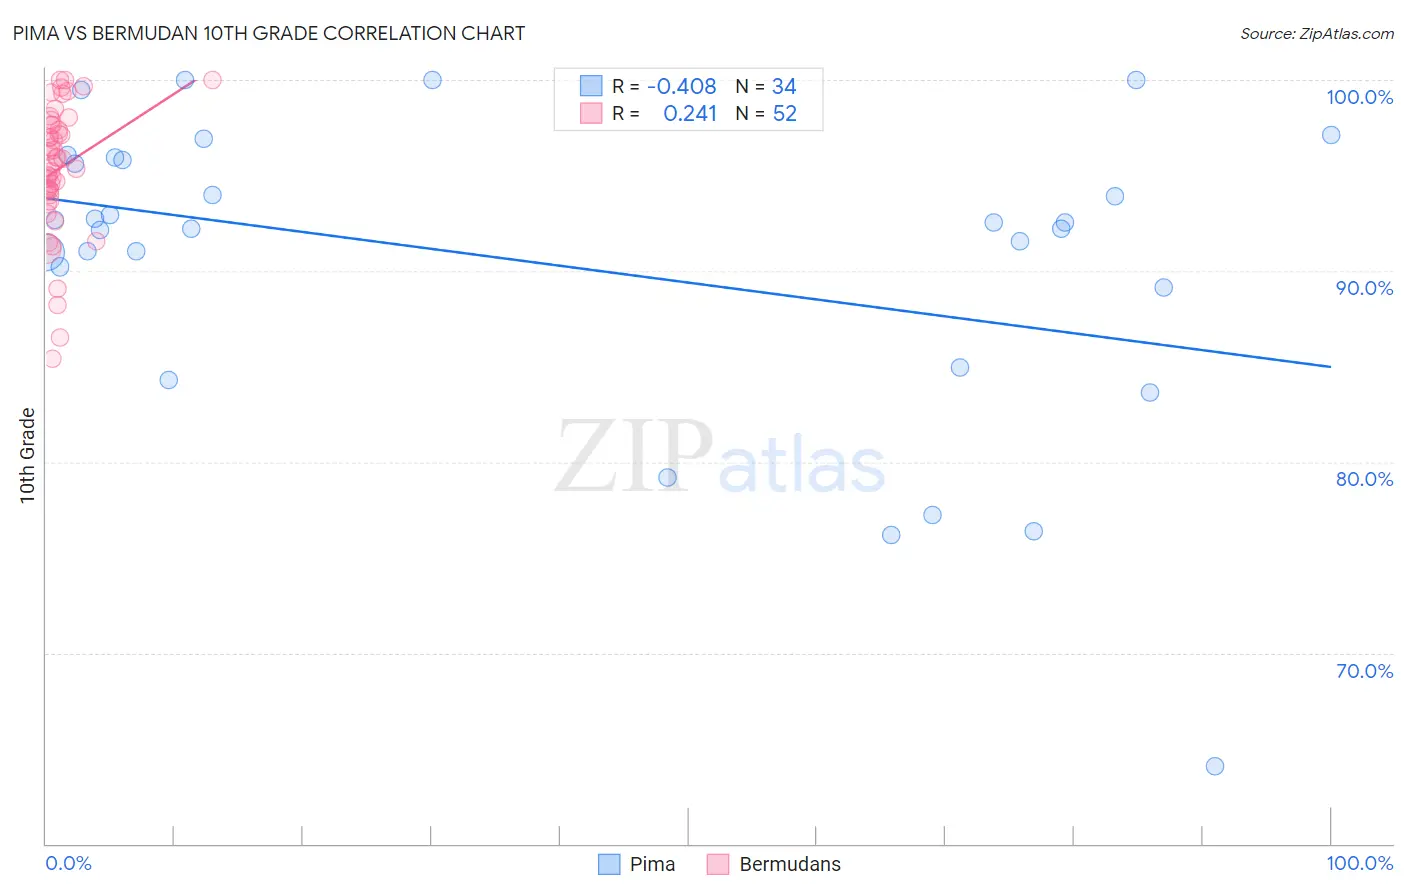
Pima vs Bermudan 10th Grade Correlation Chart
The statistical analysis conducted on geographies consisting of 61,552,942 people shows a moderate negative correlation between the proportion of Pima and percentage of population with at least 10th grade education in the United States with a correlation coefficient (R) of -0.408 and weighted average of 91.2%. Similarly, the statistical analysis conducted on geographies consisting of 55,730,379 people shows a weak positive correlation between the proportion of Bermudans and percentage of population with at least 10th grade education in the United States with a correlation coefficient (R) of 0.241 and weighted average of 93.9%, a difference of 3.0%.
10th Grade Correlation Summary
| Measurement | Pima | Bermudan |
| Minimum | 64.0% | 85.4% |
| Maximum | 100.0% | 100.0% |
| Range | 36.0% | 14.6% |
| Mean | 90.4% | 95.3% |
| Median | 92.4% | 95.8% |
| Interquartile 25% (IQ1) | 89.1% | 94.0% |
| Interquartile 75% (IQ3) | 95.8% | 97.7% |
| Interquartile Range (IQR) | 6.7% | 3.6% |
| Standard Deviation (Sample) | 8.0% | 3.4% |
| Standard Deviation (Population) | 7.9% | 3.3% |
Similar Demographics by 10th Grade
Demographics Similar to Pima by 10th Grade
In terms of 10th grade, the demographic groups most similar to Pima are Immigrants from Dominica (91.1%, a difference of 0.020%), Immigrants from Vietnam (91.2%, a difference of 0.060%), Japanese (91.2%, a difference of 0.080%), Immigrants from Guyana (91.2%, a difference of 0.080%), and Yaqui (91.1%, a difference of 0.080%).
| Demographics | Rating | Rank | 10th Grade |
| Fijians | 0.0 /100 | #297 | Tragic 91.5% |
| Cubans | 0.0 /100 | #298 | Tragic 91.5% |
| Immigrants | Haiti | 0.0 /100 | #299 | Tragic 91.4% |
| Guyanese | 0.0 /100 | #300 | Tragic 91.4% |
| Japanese | 0.0 /100 | #301 | Tragic 91.2% |
| Immigrants | Guyana | 0.0 /100 | #302 | Tragic 91.2% |
| Immigrants | Vietnam | 0.0 /100 | #303 | Tragic 91.2% |
| Pima | 0.0 /100 | #304 | Tragic 91.2% |
| Immigrants | Dominica | 0.0 /100 | #305 | Tragic 91.1% |
| Yaqui | 0.0 /100 | #306 | Tragic 91.1% |
| Immigrants | Fiji | 0.0 /100 | #307 | Tragic 91.0% |
| Immigrants | Bangladesh | 0.0 /100 | #308 | Tragic 91.0% |
| Immigrants | Immigrants | 0.0 /100 | #309 | Tragic 91.0% |
| Vietnamese | 0.0 /100 | #310 | Tragic 90.9% |
| Immigrants | Cambodia | 0.0 /100 | #311 | Tragic 90.9% |
Demographics Similar to Bermudans by 10th Grade
In terms of 10th grade, the demographic groups most similar to Bermudans are Chilean (93.9%, a difference of 0.010%), Pakistani (93.9%, a difference of 0.010%), Assyrian/Chaldean/Syriac (93.9%, a difference of 0.010%), Immigrants from Poland (93.9%, a difference of 0.020%), and Venezuelan (93.9%, a difference of 0.020%).
| Demographics | Rating | Rank | 10th Grade |
| Kenyans | 79.1 /100 | #151 | Good 94.0% |
| Immigrants | Italy | 78.0 /100 | #152 | Good 94.0% |
| Immigrants | Brazil | 75.5 /100 | #153 | Good 94.0% |
| Immigrants | Kenya | 75.3 /100 | #154 | Good 94.0% |
| Spanish | 74.9 /100 | #155 | Good 94.0% |
| Mongolians | 74.4 /100 | #156 | Good 94.0% |
| Kiowa | 73.3 /100 | #157 | Good 93.9% |
| Bermudans | 71.0 /100 | #158 | Good 93.9% |
| Chileans | 70.2 /100 | #159 | Good 93.9% |
| Pakistanis | 70.1 /100 | #160 | Good 93.9% |
| Assyrians/Chaldeans/Syriacs | 69.7 /100 | #161 | Good 93.9% |
| Immigrants | Poland | 69.6 /100 | #162 | Good 93.9% |
| Venezuelans | 69.5 /100 | #163 | Good 93.9% |
| Iraqis | 68.1 /100 | #164 | Good 93.9% |
| Brazilians | 63.6 /100 | #165 | Good 93.8% |