Immigrants from Norway vs Bermudan Female Disability
COMPARE
Immigrants from Norway
Bermudan
Female Disability
Female Disability Comparison
Immigrants from Norway
Bermudans
11.9%
FEMALE DISABILITY
93.8/ 100
METRIC RATING
137th/ 347
METRIC RANK
12.7%
FEMALE DISABILITY
1.0/ 100
METRIC RATING
261st/ 347
METRIC RANK
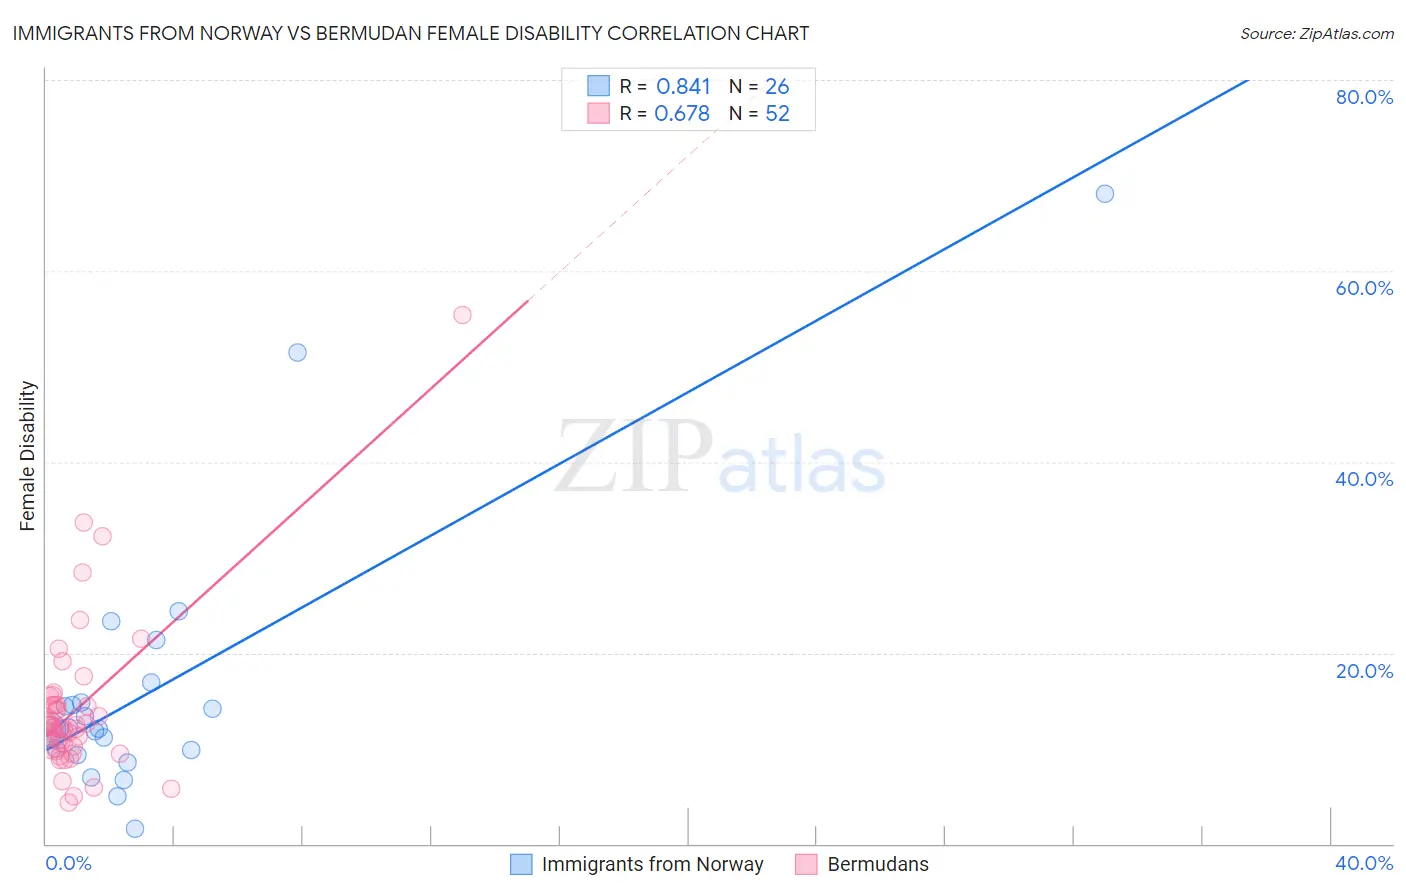
Immigrants from Norway vs Bermudan Female Disability Correlation Chart
The statistical analysis conducted on geographies consisting of 116,702,841 people shows a very strong positive correlation between the proportion of Immigrants from Norway and percentage of females with a disability in the United States with a correlation coefficient (R) of 0.841 and weighted average of 11.9%. Similarly, the statistical analysis conducted on geographies consisting of 55,721,549 people shows a significant positive correlation between the proportion of Bermudans and percentage of females with a disability in the United States with a correlation coefficient (R) of 0.678 and weighted average of 12.7%, a difference of 7.1%.
Female Disability Correlation Summary
| Measurement | Immigrants from Norway | Bermudan |
| Minimum | 1.5% | 4.4% |
| Maximum | 68.1% | 55.4% |
| Range | 66.6% | 51.1% |
| Mean | 16.0% | 14.1% |
| Median | 12.0% | 12.2% |
| Interquartile 25% (IQ1) | 9.8% | 10.1% |
| Interquartile 75% (IQ3) | 14.8% | 14.5% |
| Interquartile Range (IQR) | 5.0% | 4.5% |
| Standard Deviation (Sample) | 14.1% | 8.3% |
| Standard Deviation (Population) | 13.8% | 8.2% |
Similar Demographics by Female Disability
Demographics Similar to Immigrants from Norway by Female Disability
In terms of female disability, the demographic groups most similar to Immigrants from Norway are Ugandan (11.9%, a difference of 0.040%), Central American (11.9%, a difference of 0.060%), Ecuadorian (11.9%, a difference of 0.060%), Kenyan (11.9%, a difference of 0.13%), and Immigrants from Nicaragua (11.9%, a difference of 0.13%).
| Demographics | Rating | Rank | Female Disability |
| Nicaraguans | 95.2 /100 | #130 | Exceptional 11.9% |
| Arabs | 95.1 /100 | #131 | Exceptional 11.9% |
| Immigrants | Syria | 94.6 /100 | #132 | Exceptional 11.9% |
| Kenyans | 94.5 /100 | #133 | Exceptional 11.9% |
| Immigrants | Nicaragua | 94.5 /100 | #134 | Exceptional 11.9% |
| Central Americans | 94.2 /100 | #135 | Exceptional 11.9% |
| Ugandans | 94.0 /100 | #136 | Exceptional 11.9% |
| Immigrants | Norway | 93.8 /100 | #137 | Exceptional 11.9% |
| Ecuadorians | 93.4 /100 | #138 | Exceptional 11.9% |
| Immigrants | Hungary | 92.8 /100 | #139 | Exceptional 11.9% |
| Romanians | 91.6 /100 | #140 | Exceptional 11.9% |
| Immigrants | Ecuador | 91.5 /100 | #141 | Exceptional 11.9% |
| Immigrants | Africa | 90.0 /100 | #142 | Excellent 11.9% |
| Immigrants | Sudan | 89.6 /100 | #143 | Excellent 11.9% |
| Immigrants | Austria | 87.9 /100 | #144 | Excellent 12.0% |
Demographics Similar to Bermudans by Female Disability
In terms of female disability, the demographic groups most similar to Bermudans are Subsaharan African (12.7%, a difference of 0.040%), Immigrants from Armenia (12.7%, a difference of 0.050%), Czechoslovakian (12.7%, a difference of 0.070%), Liberian (12.7%, a difference of 0.14%), and Aleut (12.7%, a difference of 0.14%).
| Demographics | Rating | Rank | Female Disability |
| Hawaiians | 1.4 /100 | #254 | Tragic 12.7% |
| Immigrants | Germany | 1.3 /100 | #255 | Tragic 12.7% |
| British West Indians | 1.2 /100 | #256 | Tragic 12.7% |
| Liberians | 1.1 /100 | #257 | Tragic 12.7% |
| Aleuts | 1.1 /100 | #258 | Tragic 12.7% |
| Immigrants | Armenia | 1.0 /100 | #259 | Tragic 12.7% |
| Sub-Saharan Africans | 1.0 /100 | #260 | Tragic 12.7% |
| Bermudans | 1.0 /100 | #261 | Tragic 12.7% |
| Czechoslovakians | 0.9 /100 | #262 | Tragic 12.7% |
| Spaniards | 0.7 /100 | #263 | Tragic 12.8% |
| Alaska Natives | 0.6 /100 | #264 | Tragic 12.8% |
| West Indians | 0.5 /100 | #265 | Tragic 12.8% |
| Finns | 0.4 /100 | #266 | Tragic 12.8% |
| Senegalese | 0.4 /100 | #267 | Tragic 12.8% |
| Immigrants | Laos | 0.4 /100 | #268 | Tragic 12.8% |