Guamanian/Chamorro vs Bermudan Female Disability
COMPARE
Guamanian/Chamorro
Bermudan
Female Disability
Female Disability Comparison
Guamanians/Chamorros
Bermudans
12.5%
FEMALE DISABILITY
9.5/ 100
METRIC RATING
223rd/ 347
METRIC RANK
12.7%
FEMALE DISABILITY
1.0/ 100
METRIC RATING
261st/ 347
METRIC RANK
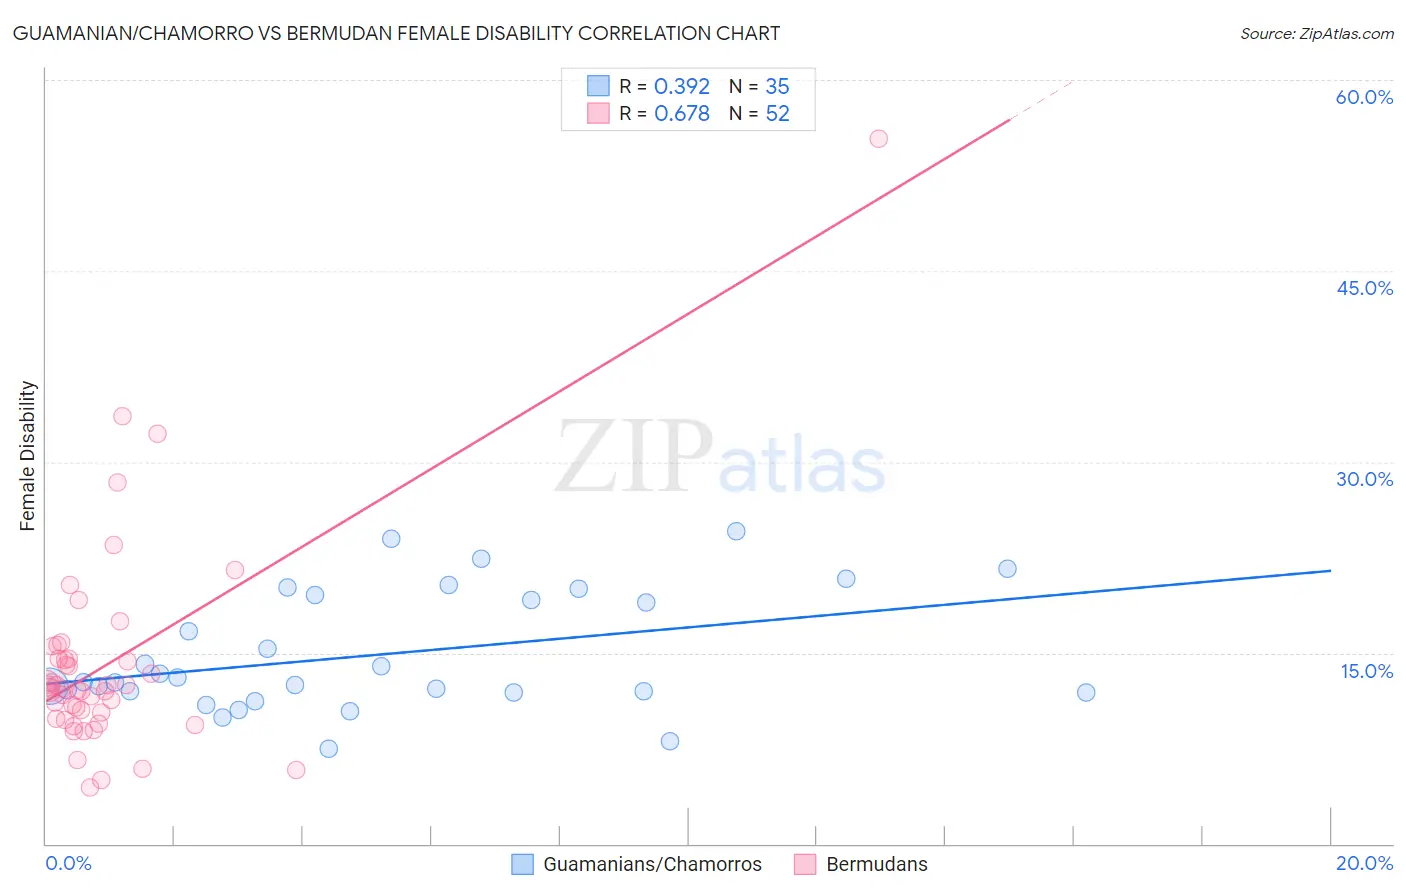
Guamanian/Chamorro vs Bermudan Female Disability Correlation Chart
The statistical analysis conducted on geographies consisting of 221,879,045 people shows a mild positive correlation between the proportion of Guamanians/Chamorros and percentage of females with a disability in the United States with a correlation coefficient (R) of 0.392 and weighted average of 12.5%. Similarly, the statistical analysis conducted on geographies consisting of 55,721,549 people shows a significant positive correlation between the proportion of Bermudans and percentage of females with a disability in the United States with a correlation coefficient (R) of 0.678 and weighted average of 12.7%, a difference of 2.2%.
Female Disability Correlation Summary
| Measurement | Guamanian/Chamorro | Bermudan |
| Minimum | 7.5% | 4.4% |
| Maximum | 24.6% | 55.4% |
| Range | 17.1% | 51.1% |
| Mean | 14.9% | 14.1% |
| Median | 12.7% | 12.2% |
| Interquartile 25% (IQ1) | 11.9% | 10.1% |
| Interquartile 75% (IQ3) | 19.5% | 14.5% |
| Interquartile Range (IQR) | 7.6% | 4.5% |
| Standard Deviation (Sample) | 4.7% | 8.3% |
| Standard Deviation (Population) | 4.6% | 8.2% |
Similar Demographics by Female Disability
Demographics Similar to Guamanians/Chamorros by Female Disability
In terms of female disability, the demographic groups most similar to Guamanians/Chamorros are Belizean (12.5%, a difference of 0.020%), Polish (12.5%, a difference of 0.12%), Italian (12.4%, a difference of 0.13%), Native Hawaiian (12.4%, a difference of 0.14%), and Bahamian (12.4%, a difference of 0.16%).
| Demographics | Rating | Rank | Female Disability |
| Immigrants | Burma/Myanmar | 13.3 /100 | #216 | Poor 12.4% |
| British | 12.7 /100 | #217 | Poor 12.4% |
| Immigrants | Bahamas | 12.5 /100 | #218 | Poor 12.4% |
| Europeans | 12.1 /100 | #219 | Poor 12.4% |
| Bahamians | 11.1 /100 | #220 | Poor 12.4% |
| Native Hawaiians | 10.8 /100 | #221 | Poor 12.4% |
| Italians | 10.7 /100 | #222 | Poor 12.4% |
| Guamanians/Chamorros | 9.5 /100 | #223 | Tragic 12.5% |
| Belizeans | 9.3 /100 | #224 | Tragic 12.5% |
| Poles | 8.4 /100 | #225 | Tragic 12.5% |
| Hispanics or Latinos | 8.0 /100 | #226 | Tragic 12.5% |
| Assyrians/Chaldeans/Syriacs | 8.0 /100 | #227 | Tragic 12.5% |
| Immigrants | Cambodia | 7.8 /100 | #228 | Tragic 12.5% |
| Hungarians | 7.2 /100 | #229 | Tragic 12.5% |
| Immigrants | Belize | 7.0 /100 | #230 | Tragic 12.5% |
Demographics Similar to Bermudans by Female Disability
In terms of female disability, the demographic groups most similar to Bermudans are Subsaharan African (12.7%, a difference of 0.040%), Immigrants from Armenia (12.7%, a difference of 0.050%), Czechoslovakian (12.7%, a difference of 0.070%), Liberian (12.7%, a difference of 0.14%), and Aleut (12.7%, a difference of 0.14%).
| Demographics | Rating | Rank | Female Disability |
| Hawaiians | 1.4 /100 | #254 | Tragic 12.7% |
| Immigrants | Germany | 1.3 /100 | #255 | Tragic 12.7% |
| British West Indians | 1.2 /100 | #256 | Tragic 12.7% |
| Liberians | 1.1 /100 | #257 | Tragic 12.7% |
| Aleuts | 1.1 /100 | #258 | Tragic 12.7% |
| Immigrants | Armenia | 1.0 /100 | #259 | Tragic 12.7% |
| Sub-Saharan Africans | 1.0 /100 | #260 | Tragic 12.7% |
| Bermudans | 1.0 /100 | #261 | Tragic 12.7% |
| Czechoslovakians | 0.9 /100 | #262 | Tragic 12.7% |
| Spaniards | 0.7 /100 | #263 | Tragic 12.8% |
| Alaska Natives | 0.6 /100 | #264 | Tragic 12.8% |
| West Indians | 0.5 /100 | #265 | Tragic 12.8% |
| Finns | 0.4 /100 | #266 | Tragic 12.8% |
| Senegalese | 0.4 /100 | #267 | Tragic 12.8% |
| Immigrants | Laos | 0.4 /100 | #268 | Tragic 12.8% |