Immigrants from Ecuador vs Bermudan Female Disability
COMPARE
Immigrants from Ecuador
Bermudan
Female Disability
Female Disability Comparison
Immigrants from Ecuador
Bermudans
11.9%
FEMALE DISABILITY
91.5/ 100
METRIC RATING
141st/ 347
METRIC RANK
12.7%
FEMALE DISABILITY
1.0/ 100
METRIC RATING
261st/ 347
METRIC RANK
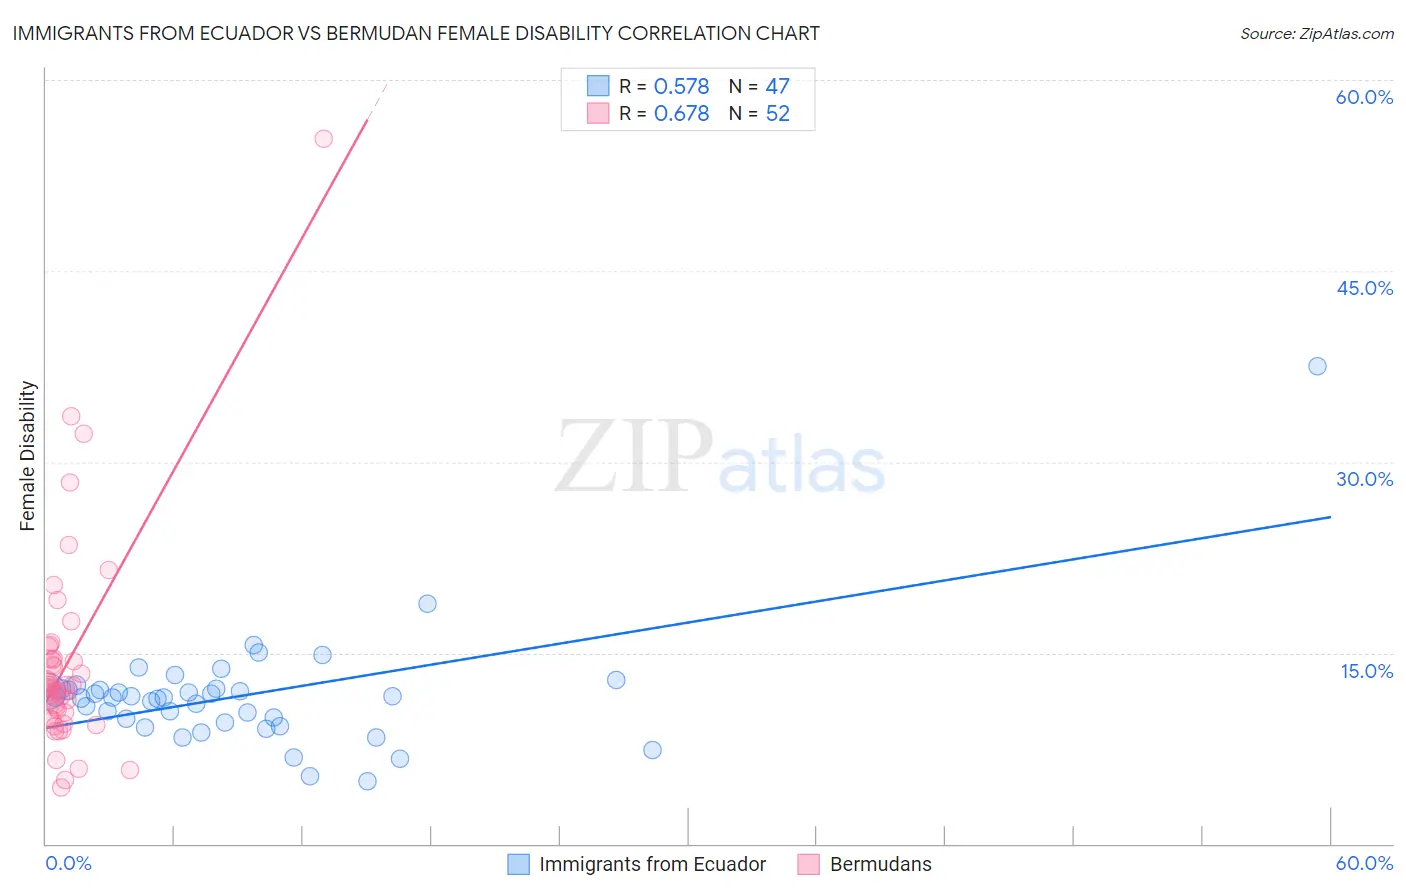
Immigrants from Ecuador vs Bermudan Female Disability Correlation Chart
The statistical analysis conducted on geographies consisting of 270,971,790 people shows a substantial positive correlation between the proportion of Immigrants from Ecuador and percentage of females with a disability in the United States with a correlation coefficient (R) of 0.578 and weighted average of 11.9%. Similarly, the statistical analysis conducted on geographies consisting of 55,721,549 people shows a significant positive correlation between the proportion of Bermudans and percentage of females with a disability in the United States with a correlation coefficient (R) of 0.678 and weighted average of 12.7%, a difference of 6.8%.
Female Disability Correlation Summary
| Measurement | Immigrants from Ecuador | Bermudan |
| Minimum | 4.9% | 4.4% |
| Maximum | 37.5% | 55.4% |
| Range | 32.6% | 51.1% |
| Mean | 11.6% | 14.1% |
| Median | 11.5% | 12.2% |
| Interquartile 25% (IQ1) | 9.5% | 10.1% |
| Interquartile 75% (IQ3) | 12.2% | 14.5% |
| Interquartile Range (IQR) | 2.6% | 4.5% |
| Standard Deviation (Sample) | 4.6% | 8.3% |
| Standard Deviation (Population) | 4.6% | 8.2% |
Similar Demographics by Female Disability
Demographics Similar to Immigrants from Ecuador by Female Disability
In terms of female disability, the demographic groups most similar to Immigrants from Ecuador are Romanian (11.9%, a difference of 0.020%), Immigrants from Africa (11.9%, a difference of 0.17%), Immigrants from Hungary (11.9%, a difference of 0.18%), Immigrants from Sudan (11.9%, a difference of 0.21%), and Ecuadorian (11.9%, a difference of 0.26%).
| Demographics | Rating | Rank | Female Disability |
| Immigrants | Nicaragua | 94.5 /100 | #134 | Exceptional 11.9% |
| Central Americans | 94.2 /100 | #135 | Exceptional 11.9% |
| Ugandans | 94.0 /100 | #136 | Exceptional 11.9% |
| Immigrants | Norway | 93.8 /100 | #137 | Exceptional 11.9% |
| Ecuadorians | 93.4 /100 | #138 | Exceptional 11.9% |
| Immigrants | Hungary | 92.8 /100 | #139 | Exceptional 11.9% |
| Romanians | 91.6 /100 | #140 | Exceptional 11.9% |
| Immigrants | Ecuador | 91.5 /100 | #141 | Exceptional 11.9% |
| Immigrants | Africa | 90.0 /100 | #142 | Excellent 11.9% |
| Immigrants | Sudan | 89.6 /100 | #143 | Excellent 11.9% |
| Immigrants | Austria | 87.9 /100 | #144 | Excellent 12.0% |
| Estonians | 87.8 /100 | #145 | Excellent 12.0% |
| Pakistanis | 84.6 /100 | #146 | Excellent 12.0% |
| Nigerians | 84.0 /100 | #147 | Excellent 12.0% |
| Immigrants | Kenya | 83.1 /100 | #148 | Excellent 12.0% |
Demographics Similar to Bermudans by Female Disability
In terms of female disability, the demographic groups most similar to Bermudans are Subsaharan African (12.7%, a difference of 0.040%), Immigrants from Armenia (12.7%, a difference of 0.050%), Czechoslovakian (12.7%, a difference of 0.070%), Liberian (12.7%, a difference of 0.14%), and Aleut (12.7%, a difference of 0.14%).
| Demographics | Rating | Rank | Female Disability |
| Hawaiians | 1.4 /100 | #254 | Tragic 12.7% |
| Immigrants | Germany | 1.3 /100 | #255 | Tragic 12.7% |
| British West Indians | 1.2 /100 | #256 | Tragic 12.7% |
| Liberians | 1.1 /100 | #257 | Tragic 12.7% |
| Aleuts | 1.1 /100 | #258 | Tragic 12.7% |
| Immigrants | Armenia | 1.0 /100 | #259 | Tragic 12.7% |
| Sub-Saharan Africans | 1.0 /100 | #260 | Tragic 12.7% |
| Bermudans | 1.0 /100 | #261 | Tragic 12.7% |
| Czechoslovakians | 0.9 /100 | #262 | Tragic 12.7% |
| Spaniards | 0.7 /100 | #263 | Tragic 12.8% |
| Alaska Natives | 0.6 /100 | #264 | Tragic 12.8% |
| West Indians | 0.5 /100 | #265 | Tragic 12.8% |
| Finns | 0.4 /100 | #266 | Tragic 12.8% |
| Senegalese | 0.4 /100 | #267 | Tragic 12.8% |
| Immigrants | Laos | 0.4 /100 | #268 | Tragic 12.8% |