Basque vs Belgian Vision Disability
COMPARE
Basque
Belgian
Vision Disability
Vision Disability Comparison
Basques
Belgians
2.3%
VISION DISABILITY
3.5/ 100
METRIC RATING
223rd/ 347
METRIC RANK
2.1%
VISION DISABILITY
75.9/ 100
METRIC RATING
150th/ 347
METRIC RANK
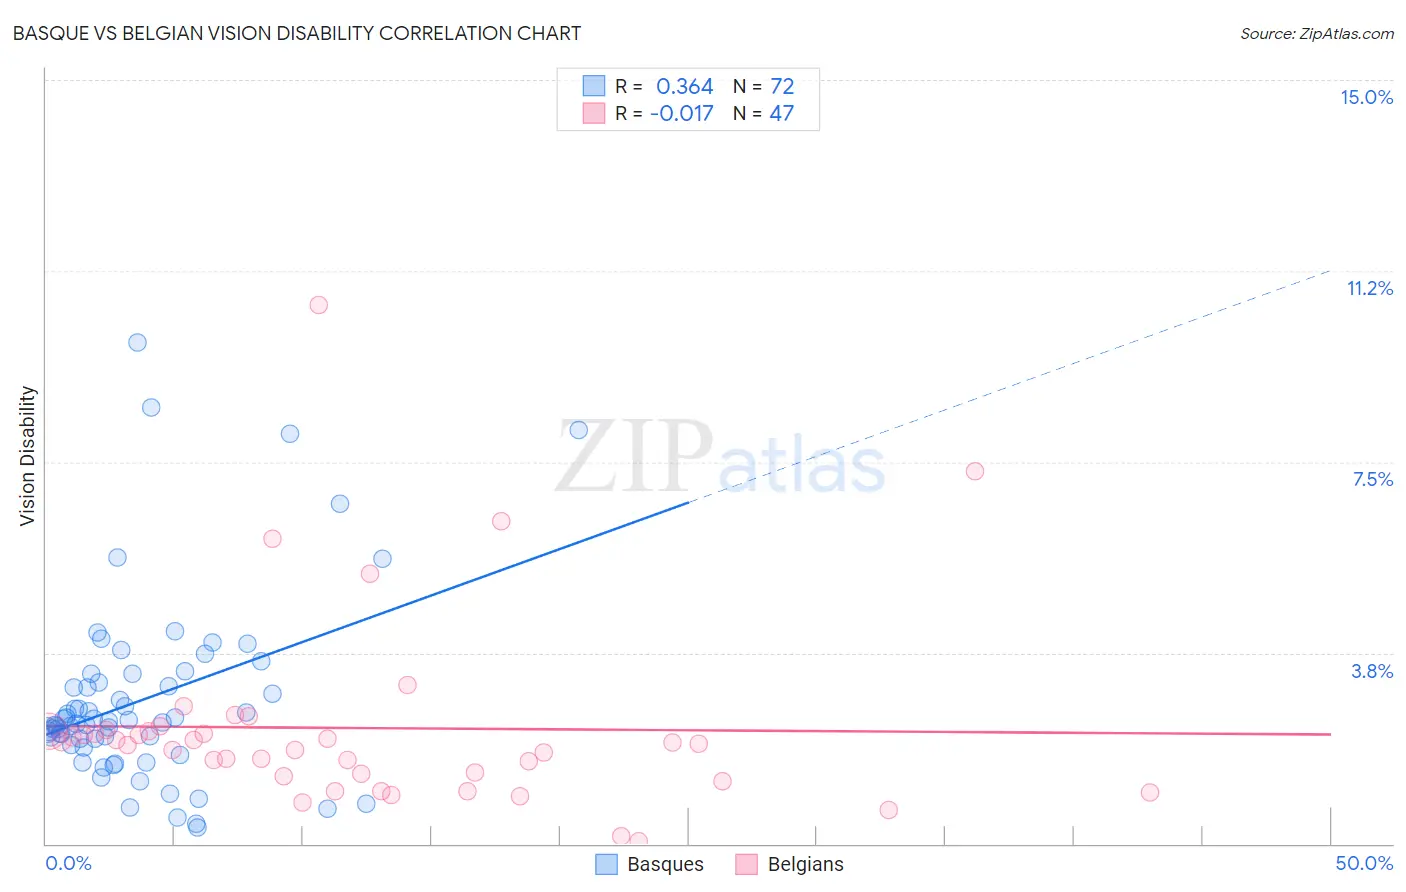
Basque vs Belgian Vision Disability Correlation Chart
The statistical analysis conducted on geographies consisting of 165,747,167 people shows a mild positive correlation between the proportion of Basques and percentage of population with vision disability in the United States with a correlation coefficient (R) of 0.364 and weighted average of 2.3%. Similarly, the statistical analysis conducted on geographies consisting of 355,727,371 people shows no correlation between the proportion of Belgians and percentage of population with vision disability in the United States with a correlation coefficient (R) of -0.017 and weighted average of 2.1%, a difference of 7.1%.
Vision Disability Correlation Summary
| Measurement | Basque | Belgian |
| Minimum | 0.32% | 0.061% |
| Maximum | 9.8% | 10.6% |
| Range | 9.5% | 10.5% |
| Mean | 2.8% | 2.3% |
| Median | 2.4% | 2.0% |
| Interquartile 25% (IQ1) | 2.0% | 1.3% |
| Interquartile 75% (IQ3) | 3.2% | 2.2% |
| Interquartile Range (IQR) | 1.3% | 0.89% |
| Standard Deviation (Sample) | 1.8% | 1.9% |
| Standard Deviation (Population) | 1.8% | 1.9% |
Similar Demographics by Vision Disability
Demographics Similar to Basques by Vision Disability
In terms of vision disability, the demographic groups most similar to Basques are Irish (2.3%, a difference of 0.020%), Immigrants from Western Africa (2.3%, a difference of 0.040%), Immigrants from Senegal (2.3%, a difference of 0.14%), French Canadian (2.3%, a difference of 0.16%), and Guamanian/Chamorro (2.3%, a difference of 0.18%).
| Demographics | Rating | Rank | Vision Disability |
| Immigrants | Trinidad and Tobago | 6.1 /100 | #216 | Tragic 2.3% |
| Barbadians | 5.1 /100 | #217 | Tragic 2.3% |
| Portuguese | 4.9 /100 | #218 | Tragic 2.3% |
| Ecuadorians | 4.6 /100 | #219 | Tragic 2.3% |
| Guamanians/Chamorros | 3.9 /100 | #220 | Tragic 2.3% |
| French Canadians | 3.9 /100 | #221 | Tragic 2.3% |
| Immigrants | Senegal | 3.8 /100 | #222 | Tragic 2.3% |
| Basques | 3.5 /100 | #223 | Tragic 2.3% |
| Irish | 3.4 /100 | #224 | Tragic 2.3% |
| Immigrants | Western Africa | 3.4 /100 | #225 | Tragic 2.3% |
| Immigrants | Germany | 3.0 /100 | #226 | Tragic 2.3% |
| Hawaiians | 2.9 /100 | #227 | Tragic 2.3% |
| Hmong | 2.5 /100 | #228 | Tragic 2.3% |
| Welsh | 2.3 /100 | #229 | Tragic 2.3% |
| Nicaraguans | 2.2 /100 | #230 | Tragic 2.3% |
Demographics Similar to Belgians by Vision Disability
In terms of vision disability, the demographic groups most similar to Belgians are Colombian (2.1%, a difference of 0.030%), Immigrants from Norway (2.1%, a difference of 0.040%), Immigrants from Southern Europe (2.1%, a difference of 0.11%), Immigrants from South America (2.1%, a difference of 0.18%), and Slovene (2.1%, a difference of 0.19%).
| Demographics | Rating | Rank | Vision Disability |
| Immigrants | Sierra Leone | 82.8 /100 | #143 | Excellent 2.1% |
| Ukrainians | 81.9 /100 | #144 | Excellent 2.1% |
| Immigrants | Bosnia and Herzegovina | 81.5 /100 | #145 | Excellent 2.1% |
| Italians | 79.7 /100 | #146 | Good 2.1% |
| Immigrants | Sudan | 78.4 /100 | #147 | Good 2.1% |
| Finns | 78.3 /100 | #148 | Good 2.1% |
| Colombians | 76.2 /100 | #149 | Good 2.1% |
| Belgians | 75.9 /100 | #150 | Good 2.1% |
| Immigrants | Norway | 75.5 /100 | #151 | Good 2.1% |
| Immigrants | Southern Europe | 74.6 /100 | #152 | Good 2.1% |
| Immigrants | South America | 73.8 /100 | #153 | Good 2.1% |
| Slovenes | 73.6 /100 | #154 | Good 2.1% |
| Immigrants | Colombia | 72.1 /100 | #155 | Good 2.1% |
| Pakistanis | 71.6 /100 | #156 | Good 2.1% |
| Serbians | 70.2 /100 | #157 | Good 2.1% |