Immigrants from Sri Lanka vs Belgian Vision Disability
COMPARE
Immigrants from Sri Lanka
Belgian
Vision Disability
Vision Disability Comparison
Immigrants from Sri Lanka
Belgians
1.9%
VISION DISABILITY
100.0/ 100
METRIC RATING
19th/ 347
METRIC RANK
2.1%
VISION DISABILITY
75.9/ 100
METRIC RATING
150th/ 347
METRIC RANK
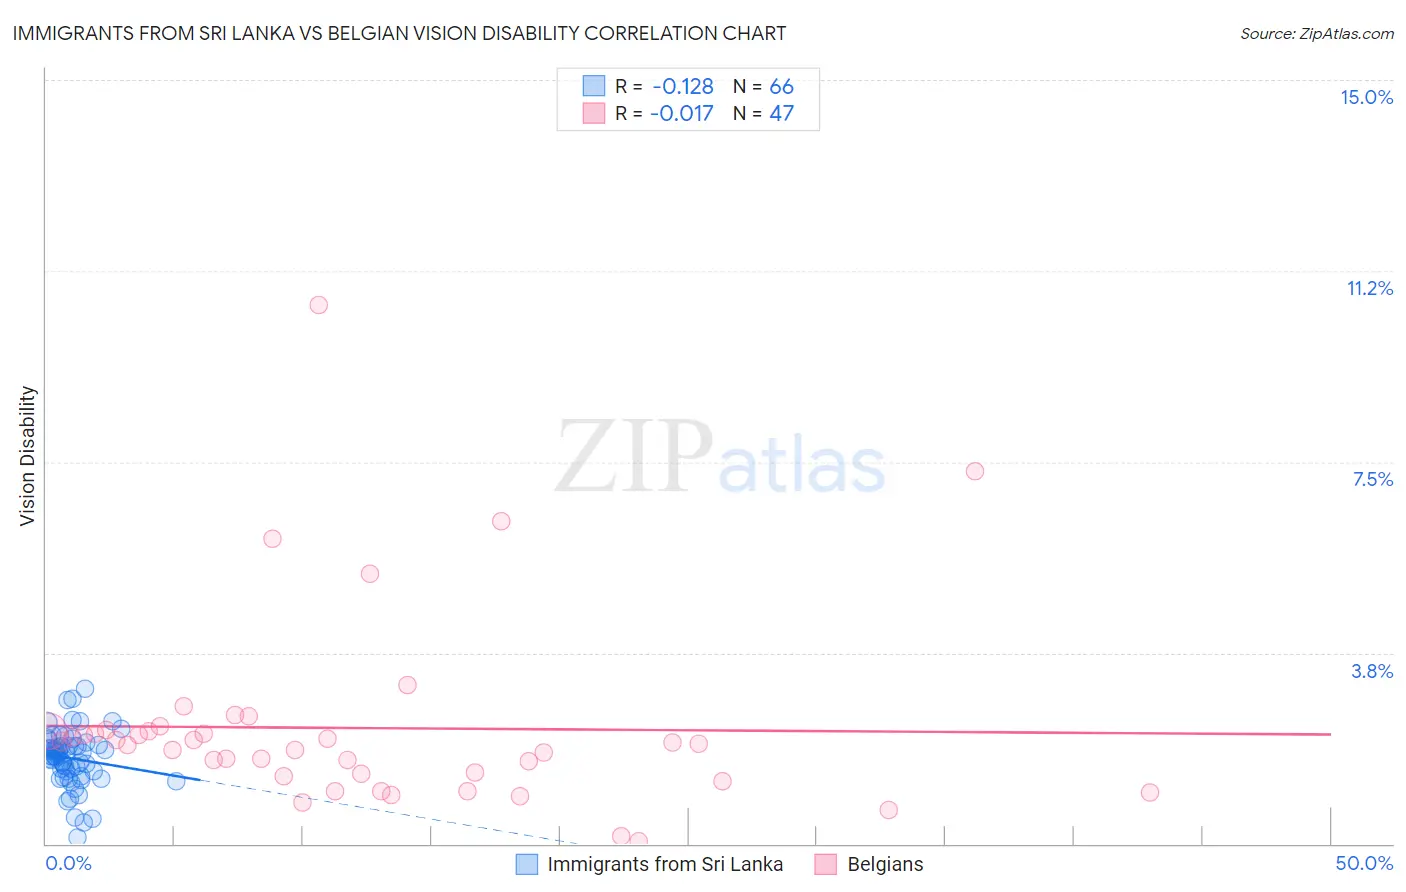
Immigrants from Sri Lanka vs Belgian Vision Disability Correlation Chart
The statistical analysis conducted on geographies consisting of 149,673,747 people shows a poor negative correlation between the proportion of Immigrants from Sri Lanka and percentage of population with vision disability in the United States with a correlation coefficient (R) of -0.128 and weighted average of 1.9%. Similarly, the statistical analysis conducted on geographies consisting of 355,727,371 people shows no correlation between the proportion of Belgians and percentage of population with vision disability in the United States with a correlation coefficient (R) of -0.017 and weighted average of 2.1%, a difference of 13.1%.
Vision Disability Correlation Summary
| Measurement | Immigrants from Sri Lanka | Belgian |
| Minimum | 0.13% | 0.061% |
| Maximum | 3.0% | 10.6% |
| Range | 2.9% | 10.5% |
| Mean | 1.7% | 2.3% |
| Median | 1.7% | 2.0% |
| Interquartile 25% (IQ1) | 1.4% | 1.3% |
| Interquartile 75% (IQ3) | 1.9% | 2.2% |
| Interquartile Range (IQR) | 0.50% | 0.89% |
| Standard Deviation (Sample) | 0.55% | 1.9% |
| Standard Deviation (Population) | 0.54% | 1.9% |
Similar Demographics by Vision Disability
Demographics Similar to Immigrants from Sri Lanka by Vision Disability
In terms of vision disability, the demographic groups most similar to Immigrants from Sri Lanka are Asian (1.9%, a difference of 1.1%), Bolivian (1.9%, a difference of 1.2%), Turkish (1.9%, a difference of 1.4%), Immigrants from Pakistan (1.9%, a difference of 1.4%), and Indian (Asian) (1.8%, a difference of 1.7%).
| Demographics | Rating | Rank | Vision Disability |
| Immigrants | Korea | 100.0 /100 | #12 | Exceptional 1.8% |
| Immigrants | Eastern Asia | 100.0 /100 | #13 | Exceptional 1.8% |
| Immigrants | China | 100.0 /100 | #14 | Exceptional 1.8% |
| Immigrants | Bolivia | 100.0 /100 | #15 | Exceptional 1.8% |
| Indians (Asian) | 100.0 /100 | #16 | Exceptional 1.8% |
| Burmese | 100.0 /100 | #17 | Exceptional 1.8% |
| Bolivians | 100.0 /100 | #18 | Exceptional 1.9% |
| Immigrants | Sri Lanka | 100.0 /100 | #19 | Exceptional 1.9% |
| Asians | 100.0 /100 | #20 | Exceptional 1.9% |
| Turks | 100.0 /100 | #21 | Exceptional 1.9% |
| Immigrants | Pakistan | 100.0 /100 | #22 | Exceptional 1.9% |
| Immigrants | Asia | 99.9 /100 | #23 | Exceptional 1.9% |
| Immigrants | Lithuania | 99.9 /100 | #24 | Exceptional 1.9% |
| Bulgarians | 99.9 /100 | #25 | Exceptional 1.9% |
| Immigrants | Japan | 99.9 /100 | #26 | Exceptional 1.9% |
Demographics Similar to Belgians by Vision Disability
In terms of vision disability, the demographic groups most similar to Belgians are Colombian (2.1%, a difference of 0.030%), Immigrants from Norway (2.1%, a difference of 0.040%), Immigrants from Southern Europe (2.1%, a difference of 0.11%), Immigrants from South America (2.1%, a difference of 0.18%), and Slovene (2.1%, a difference of 0.19%).
| Demographics | Rating | Rank | Vision Disability |
| Immigrants | Sierra Leone | 82.8 /100 | #143 | Excellent 2.1% |
| Ukrainians | 81.9 /100 | #144 | Excellent 2.1% |
| Immigrants | Bosnia and Herzegovina | 81.5 /100 | #145 | Excellent 2.1% |
| Italians | 79.7 /100 | #146 | Good 2.1% |
| Immigrants | Sudan | 78.4 /100 | #147 | Good 2.1% |
| Finns | 78.3 /100 | #148 | Good 2.1% |
| Colombians | 76.2 /100 | #149 | Good 2.1% |
| Belgians | 75.9 /100 | #150 | Good 2.1% |
| Immigrants | Norway | 75.5 /100 | #151 | Good 2.1% |
| Immigrants | Southern Europe | 74.6 /100 | #152 | Good 2.1% |
| Immigrants | South America | 73.8 /100 | #153 | Good 2.1% |
| Slovenes | 73.6 /100 | #154 | Good 2.1% |
| Immigrants | Colombia | 72.1 /100 | #155 | Good 2.1% |
| Pakistanis | 71.6 /100 | #156 | Good 2.1% |
| Serbians | 70.2 /100 | #157 | Good 2.1% |