Pima vs Aleut In Labor Force | Age 20-24
COMPARE
Pima
Aleut
In Labor Force | Age 20-24
In Labor Force | Age 20-24 Comparison
Pima
Aleuts
69.0%
IN LABOR FORCE | AGE 20-24
0.0/ 100
METRIC RATING
338th/ 347
METRIC RANK
79.0%
IN LABOR FORCE | AGE 20-24
100.0/ 100
METRIC RATING
5th/ 347
METRIC RANK
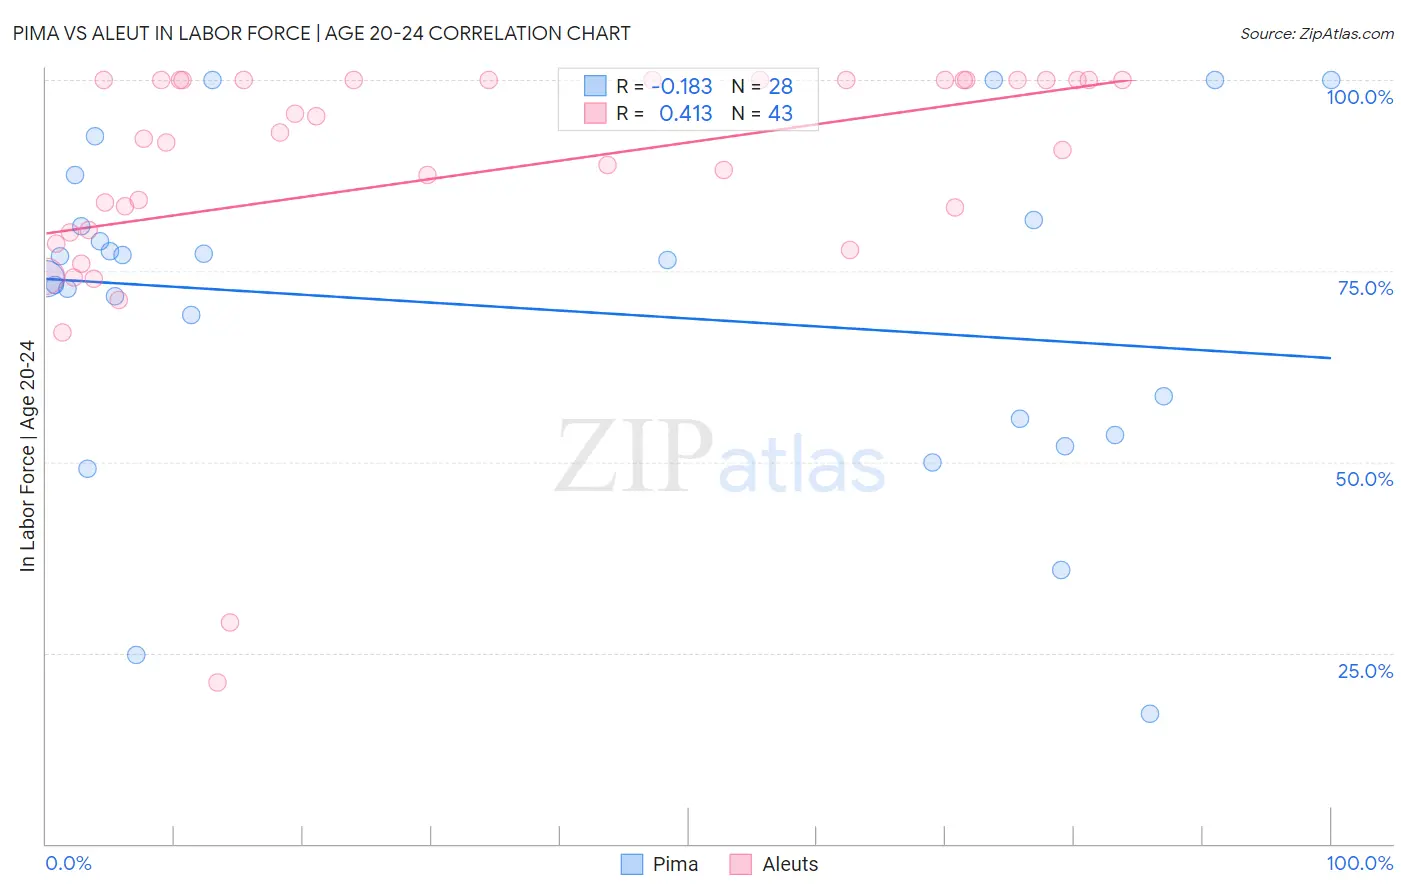
Pima vs Aleut In Labor Force | Age 20-24 Correlation Chart
The statistical analysis conducted on geographies consisting of 61,528,696 people shows a poor negative correlation between the proportion of Pima and labor force participation rate among population between the ages 20 and 24 in the United States with a correlation coefficient (R) of -0.183 and weighted average of 69.0%. Similarly, the statistical analysis conducted on geographies consisting of 61,769,180 people shows a moderate positive correlation between the proportion of Aleuts and labor force participation rate among population between the ages 20 and 24 in the United States with a correlation coefficient (R) of 0.413 and weighted average of 79.0%, a difference of 14.5%.
In Labor Force | Age 20-24 Correlation Summary
| Measurement | Pima | Aleut |
| Minimum | 17.1% | 21.1% |
| Maximum | 100.0% | 100.0% |
| Range | 82.9% | 78.9% |
| Mean | 70.2% | 87.5% |
| Median | 75.2% | 92.3% |
| Interquartile 25% (IQ1) | 54.6% | 80.1% |
| Interquartile 75% (IQ3) | 81.2% | 100.0% |
| Interquartile Range (IQR) | 26.6% | 19.9% |
| Standard Deviation (Sample) | 21.8% | 17.3% |
| Standard Deviation (Population) | 21.4% | 17.1% |
Similar Demographics by In Labor Force | Age 20-24
Demographics Similar to Pima by In Labor Force | Age 20-24
In terms of in labor force | age 20-24, the demographic groups most similar to Pima are Immigrants from Yemen (68.9%, a difference of 0.13%), Guyanese (69.2%, a difference of 0.26%), Immigrants from Guyana (69.3%, a difference of 0.39%), Menominee (68.7%, a difference of 0.44%), and Tohono O'odham (68.6%, a difference of 0.57%).
| Demographics | Rating | Rank | In Labor Force | Age 20-24 |
| Immigrants | Bangladesh | 0.0 /100 | #331 | Tragic 70.6% |
| Immigrants | Uzbekistan | 0.0 /100 | #332 | Tragic 70.4% |
| Yuman | 0.0 /100 | #333 | Tragic 70.3% |
| British West Indians | 0.0 /100 | #334 | Tragic 70.0% |
| Immigrants | Barbados | 0.0 /100 | #335 | Tragic 69.7% |
| Immigrants | Guyana | 0.0 /100 | #336 | Tragic 69.3% |
| Guyanese | 0.0 /100 | #337 | Tragic 69.2% |
| Pima | 0.0 /100 | #338 | Tragic 69.0% |
| Immigrants | Yemen | 0.0 /100 | #339 | Tragic 68.9% |
| Menominee | 0.0 /100 | #340 | Tragic 68.7% |
| Tohono O'odham | 0.0 /100 | #341 | Tragic 68.6% |
| Immigrants | St. Vincent and the Grenadines | 0.0 /100 | #342 | Tragic 68.4% |
| Puerto Ricans | 0.0 /100 | #343 | Tragic 68.3% |
| Immigrants | Grenada | 0.0 /100 | #344 | Tragic 67.2% |
| Hopi | 0.0 /100 | #345 | Tragic 66.0% |
Demographics Similar to Aleuts by In Labor Force | Age 20-24
In terms of in labor force | age 20-24, the demographic groups most similar to Aleuts are Danish (79.0%, a difference of 0.010%), Luxembourger (79.0%, a difference of 0.050%), Alaskan Athabascan (79.1%, a difference of 0.14%), Immigrants from Cabo Verde (78.9%, a difference of 0.16%), and Swedish (78.8%, a difference of 0.22%).
| Demographics | Rating | Rank | In Labor Force | Age 20-24 |
| Norwegians | 100.0 /100 | #1 | Exceptional 80.1% |
| Immigrants | Somalia | 100.0 /100 | #2 | Exceptional 79.5% |
| Somalis | 100.0 /100 | #3 | Exceptional 79.3% |
| Alaskan Athabascans | 100.0 /100 | #4 | Exceptional 79.1% |
| Aleuts | 100.0 /100 | #5 | Exceptional 79.0% |
| Danes | 100.0 /100 | #6 | Exceptional 79.0% |
| Luxembourgers | 100.0 /100 | #7 | Exceptional 79.0% |
| Immigrants | Cabo Verde | 100.0 /100 | #8 | Exceptional 78.9% |
| Swedes | 100.0 /100 | #9 | Exceptional 78.8% |
| Slovenes | 100.0 /100 | #10 | Exceptional 78.7% |
| Finns | 100.0 /100 | #11 | Exceptional 78.7% |
| Germans | 100.0 /100 | #12 | Exceptional 78.6% |
| Scandinavians | 100.0 /100 | #13 | Exceptional 78.5% |
| Czechs | 100.0 /100 | #14 | Exceptional 78.5% |
| Sudanese | 100.0 /100 | #15 | Exceptional 78.4% |