Pennsylvania German vs Immigrants from Southern Europe Female Disability
COMPARE
Pennsylvania German
Immigrants from Southern Europe
Female Disability
Female Disability Comparison
Pennsylvania Germans
Immigrants from Southern Europe
13.4%
FEMALE DISABILITY
0.0/ 100
METRIC RATING
300th/ 347
METRIC RANK
12.2%
FEMALE DISABILITY
56.3/ 100
METRIC RATING
171st/ 347
METRIC RANK
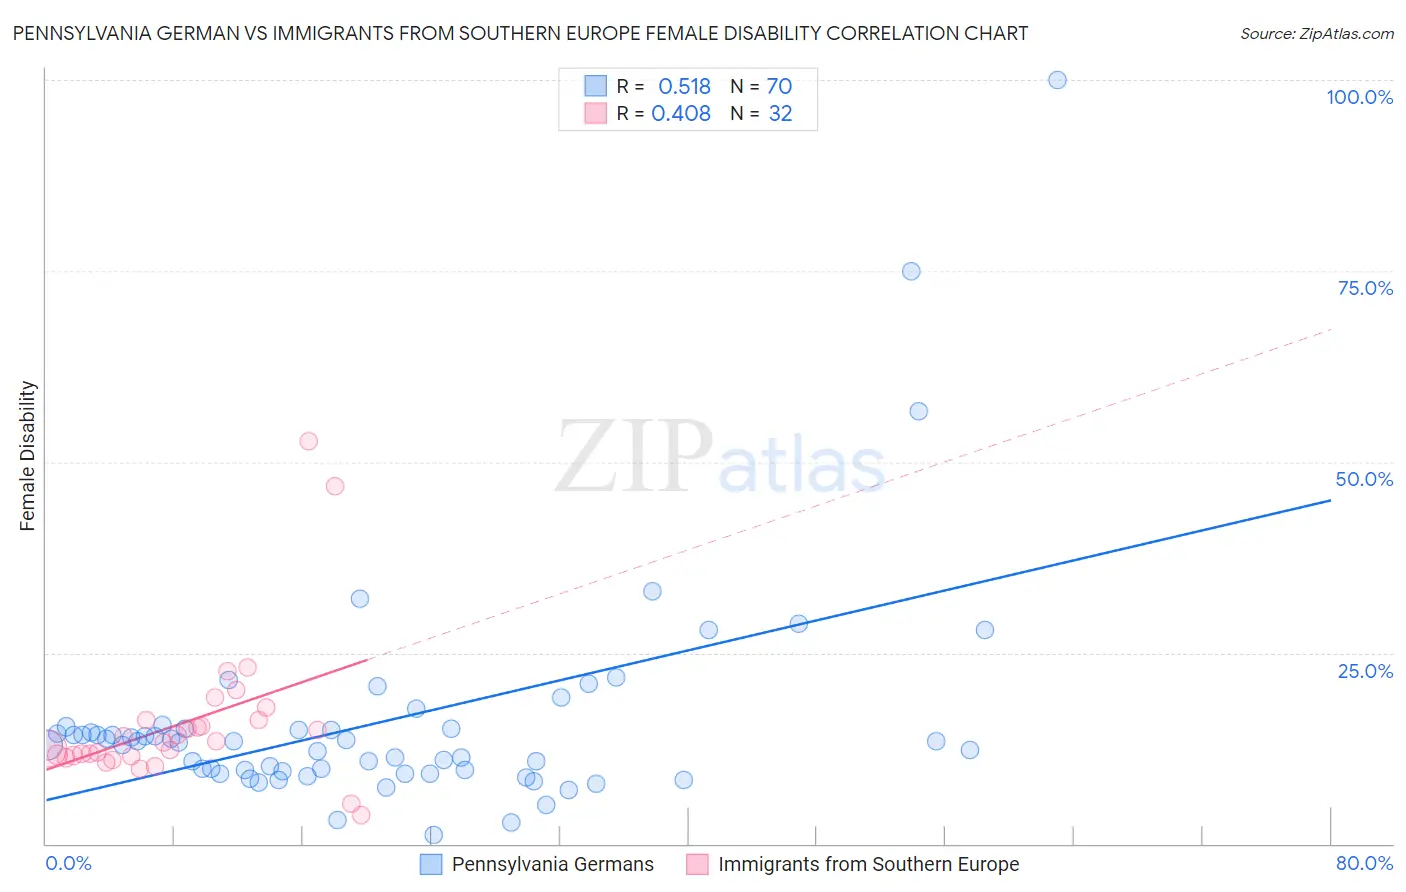
Pennsylvania German vs Immigrants from Southern Europe Female Disability Correlation Chart
The statistical analysis conducted on geographies consisting of 234,097,367 people shows a substantial positive correlation between the proportion of Pennsylvania Germans and percentage of females with a disability in the United States with a correlation coefficient (R) of 0.518 and weighted average of 13.4%. Similarly, the statistical analysis conducted on geographies consisting of 402,770,343 people shows a moderate positive correlation between the proportion of Immigrants from Southern Europe and percentage of females with a disability in the United States with a correlation coefficient (R) of 0.408 and weighted average of 12.2%, a difference of 10.2%.
Female Disability Correlation Summary
| Measurement | Pennsylvania German | Immigrants from Southern Europe |
| Minimum | 1.2% | 3.7% |
| Maximum | 100.0% | 52.8% |
| Range | 98.8% | 49.1% |
| Mean | 16.0% | 15.8% |
| Median | 13.3% | 13.3% |
| Interquartile 25% (IQ1) | 9.4% | 11.5% |
| Interquartile 75% (IQ3) | 15.1% | 16.2% |
| Interquartile Range (IQR) | 5.6% | 4.7% |
| Standard Deviation (Sample) | 14.9% | 9.8% |
| Standard Deviation (Population) | 14.8% | 9.7% |
Similar Demographics by Female Disability
Demographics Similar to Pennsylvania Germans by Female Disability
In terms of female disability, the demographic groups most similar to Pennsylvania Germans are Immigrants from Dominican Republic (13.4%, a difference of 0.010%), African (13.4%, a difference of 0.20%), Nonimmigrants (13.4%, a difference of 0.27%), Scotch-Irish (13.4%, a difference of 0.34%), and Immigrants from Portugal (13.5%, a difference of 0.34%).
| Demographics | Rating | Rank | Female Disability |
| Marshallese | 0.0 /100 | #293 | Tragic 13.3% |
| Celtics | 0.0 /100 | #294 | Tragic 13.3% |
| French | 0.0 /100 | #295 | Tragic 13.3% |
| Nepalese | 0.0 /100 | #296 | Tragic 13.3% |
| Slovaks | 0.0 /100 | #297 | Tragic 13.3% |
| Immigrants | Nonimmigrants | 0.0 /100 | #298 | Tragic 13.4% |
| Immigrants | Dominican Republic | 0.0 /100 | #299 | Tragic 13.4% |
| Pennsylvania Germans | 0.0 /100 | #300 | Tragic 13.4% |
| Africans | 0.0 /100 | #301 | Tragic 13.4% |
| Scotch-Irish | 0.0 /100 | #302 | Tragic 13.4% |
| Immigrants | Portugal | 0.0 /100 | #303 | Tragic 13.5% |
| Immigrants | Micronesia | 0.0 /100 | #304 | Tragic 13.5% |
| Dominicans | 0.0 /100 | #305 | Tragic 13.5% |
| French Canadians | 0.0 /100 | #306 | Tragic 13.6% |
| Central American Indians | 0.0 /100 | #307 | Tragic 13.6% |
Demographics Similar to Immigrants from Southern Europe by Female Disability
In terms of female disability, the demographic groups most similar to Immigrants from Southern Europe are Maltese (12.2%, a difference of 0.030%), Lebanese (12.2%, a difference of 0.070%), Immigrants from Haiti (12.2%, a difference of 0.10%), Immigrants from Latin America (12.2%, a difference of 0.11%), and Lithuanian (12.2%, a difference of 0.12%).
| Demographics | Rating | Rank | Female Disability |
| Czechs | 63.6 /100 | #164 | Good 12.1% |
| Immigrants | Oceania | 61.8 /100 | #165 | Good 12.1% |
| Lithuanians | 59.5 /100 | #166 | Average 12.2% |
| Immigrants | Latin America | 59.0 /100 | #167 | Average 12.2% |
| Immigrants | Haiti | 58.8 /100 | #168 | Average 12.2% |
| Lebanese | 58.1 /100 | #169 | Average 12.2% |
| Maltese | 57.0 /100 | #170 | Average 12.2% |
| Immigrants | Southern Europe | 56.3 /100 | #171 | Average 12.2% |
| Haitians | 51.9 /100 | #172 | Average 12.2% |
| Immigrants | Mexico | 50.8 /100 | #173 | Average 12.2% |
| Immigrants | England | 50.0 /100 | #174 | Average 12.2% |
| Immigrants | St. Vincent and the Grenadines | 49.7 /100 | #175 | Average 12.2% |
| Immigrants | Guyana | 43.1 /100 | #176 | Average 12.2% |
| Immigrants | Ghana | 42.5 /100 | #177 | Average 12.2% |
| Immigrants | Western Europe | 40.9 /100 | #178 | Average 12.2% |