Pennsylvania German vs Mexican Male Poverty
COMPARE
Pennsylvania German
Mexican
Male Poverty
Male Poverty Comparison
Pennsylvania Germans
Mexicans
11.2%
MALE POVERTY
50.5/ 100
METRIC RATING
173rd/ 347
METRIC RANK
13.7%
MALE POVERTY
0.0/ 100
METRIC RATING
280th/ 347
METRIC RANK
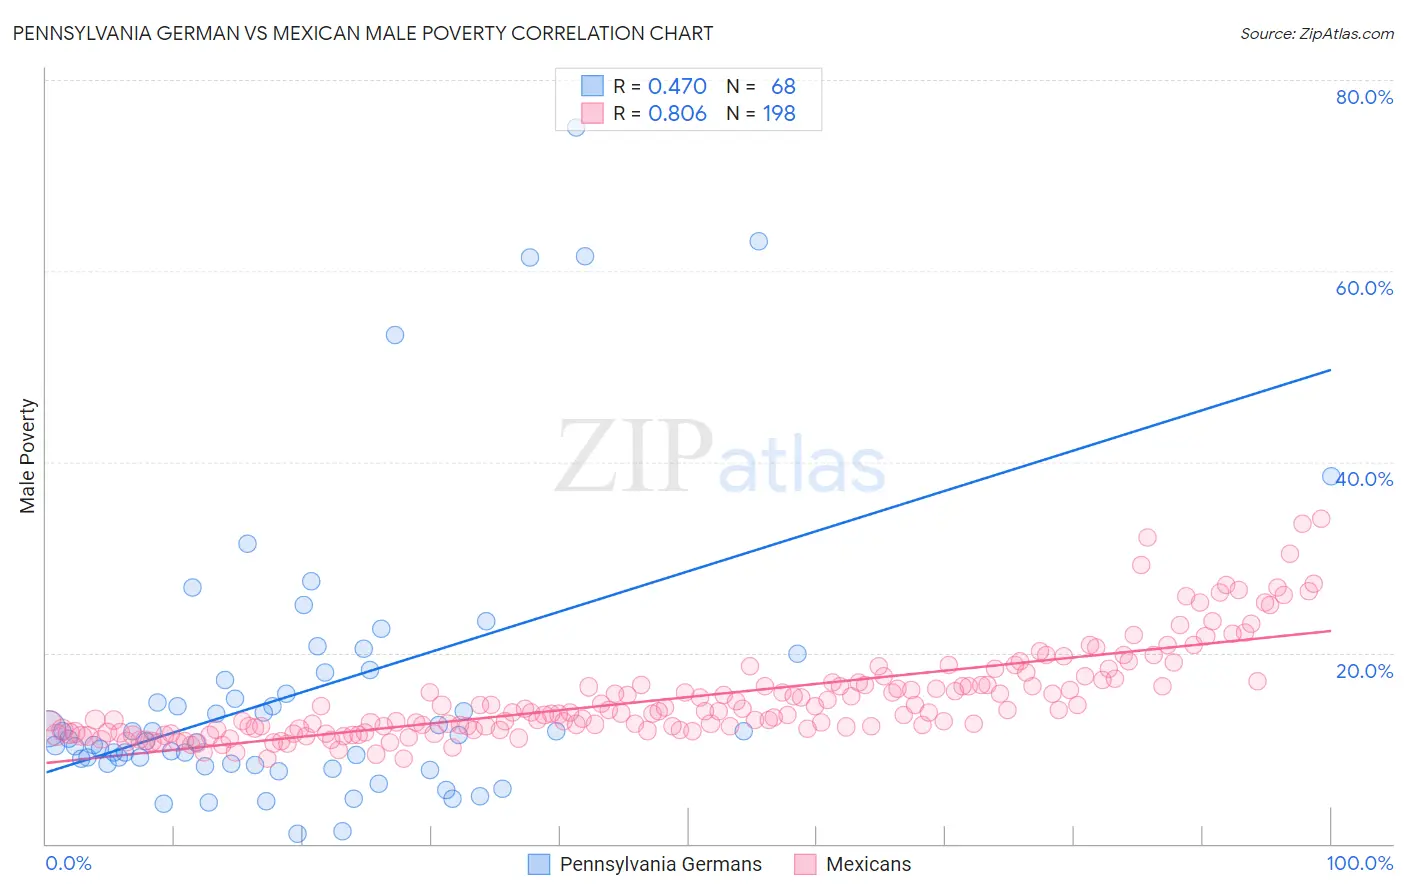
Pennsylvania German vs Mexican Male Poverty Correlation Chart
The statistical analysis conducted on geographies consisting of 233,970,359 people shows a moderate positive correlation between the proportion of Pennsylvania Germans and poverty level among males in the United States with a correlation coefficient (R) of 0.470 and weighted average of 11.2%. Similarly, the statistical analysis conducted on geographies consisting of 563,818,602 people shows a very strong positive correlation between the proportion of Mexicans and poverty level among males in the United States with a correlation coefficient (R) of 0.806 and weighted average of 13.7%, a difference of 22.3%.
Male Poverty Correlation Summary
| Measurement | Pennsylvania German | Mexican |
| Minimum | 1.1% | 8.9% |
| Maximum | 75.0% | 34.1% |
| Range | 73.9% | 25.2% |
| Mean | 16.1% | 15.3% |
| Median | 11.2% | 13.7% |
| Interquartile 25% (IQ1) | 8.3% | 11.9% |
| Interquartile 75% (IQ3) | 17.5% | 16.7% |
| Interquartile Range (IQR) | 9.2% | 4.8% |
| Standard Deviation (Sample) | 15.1% | 4.9% |
| Standard Deviation (Population) | 15.0% | 4.9% |
Similar Demographics by Male Poverty
Demographics Similar to Pennsylvania Germans by Male Poverty
In terms of male poverty, the demographic groups most similar to Pennsylvania Germans are Immigrants from Ethiopia (11.2%, a difference of 0.020%), Immigrants from Oceania (11.2%, a difference of 0.040%), Uruguayan (11.2%, a difference of 0.060%), Celtic (11.2%, a difference of 0.29%), and South American (11.1%, a difference of 0.32%).
| Demographics | Rating | Rank | Male Poverty |
| Immigrants | Albania | 55.3 /100 | #166 | Average 11.1% |
| Hungarians | 55.1 /100 | #167 | Average 11.1% |
| Immigrants | Portugal | 54.9 /100 | #168 | Average 11.1% |
| Immigrants | Colombia | 54.2 /100 | #169 | Average 11.1% |
| South Americans | 53.8 /100 | #170 | Average 11.1% |
| Uruguayans | 51.0 /100 | #171 | Average 11.2% |
| Immigrants | Ethiopia | 50.7 /100 | #172 | Average 11.2% |
| Pennsylvania Germans | 50.5 /100 | #173 | Average 11.2% |
| Immigrants | Oceania | 50.0 /100 | #174 | Average 11.2% |
| Celtics | 47.5 /100 | #175 | Average 11.2% |
| Immigrants | Fiji | 46.0 /100 | #176 | Average 11.2% |
| Lebanese | 45.6 /100 | #177 | Average 11.2% |
| Immigrants | Cameroon | 44.5 /100 | #178 | Average 11.2% |
| Immigrants | Syria | 40.3 /100 | #179 | Average 11.3% |
| Immigrants | Morocco | 40.1 /100 | #180 | Average 11.3% |
Demographics Similar to Mexicans by Male Poverty
In terms of male poverty, the demographic groups most similar to Mexicans are Yaqui (13.7%, a difference of 0.050%), Haitian (13.7%, a difference of 0.090%), Belizean (13.6%, a difference of 0.27%), Immigrants from Cabo Verde (13.7%, a difference of 0.32%), and Bangladeshi (13.6%, a difference of 0.37%).
| Demographics | Rating | Rank | Male Poverty |
| Chickasaw | 0.0 /100 | #273 | Tragic 13.5% |
| Immigrants | West Indies | 0.0 /100 | #274 | Tragic 13.5% |
| Barbadians | 0.0 /100 | #275 | Tragic 13.6% |
| Immigrants | Latin America | 0.0 /100 | #276 | Tragic 13.6% |
| Bangladeshis | 0.0 /100 | #277 | Tragic 13.6% |
| Belizeans | 0.0 /100 | #278 | Tragic 13.6% |
| Haitians | 0.0 /100 | #279 | Tragic 13.7% |
| Mexicans | 0.0 /100 | #280 | Tragic 13.7% |
| Yaqui | 0.0 /100 | #281 | Tragic 13.7% |
| Immigrants | Cabo Verde | 0.0 /100 | #282 | Tragic 13.7% |
| Comanche | 0.0 /100 | #283 | Tragic 13.8% |
| Immigrants | Haiti | 0.0 /100 | #284 | Tragic 13.8% |
| West Indians | 0.0 /100 | #285 | Tragic 13.8% |
| Shoshone | 0.0 /100 | #286 | Tragic 13.8% |
| Immigrants | Barbados | 0.0 /100 | #287 | Tragic 13.8% |