Hawaiian vs Lumbee Disability Age Under 5
COMPARE
Hawaiian
Lumbee
Disability Age Under 5
Disability Age Under 5 Comparison
Hawaiians
Lumbee
1.2%
DISABILITY AGE UNDER 5
68.5/ 100
METRIC RATING
156th/ 347
METRIC RANK
1.3%
DISABILITY AGE UNDER 5
2.1/ 100
METRIC RATING
242nd/ 347
METRIC RANK
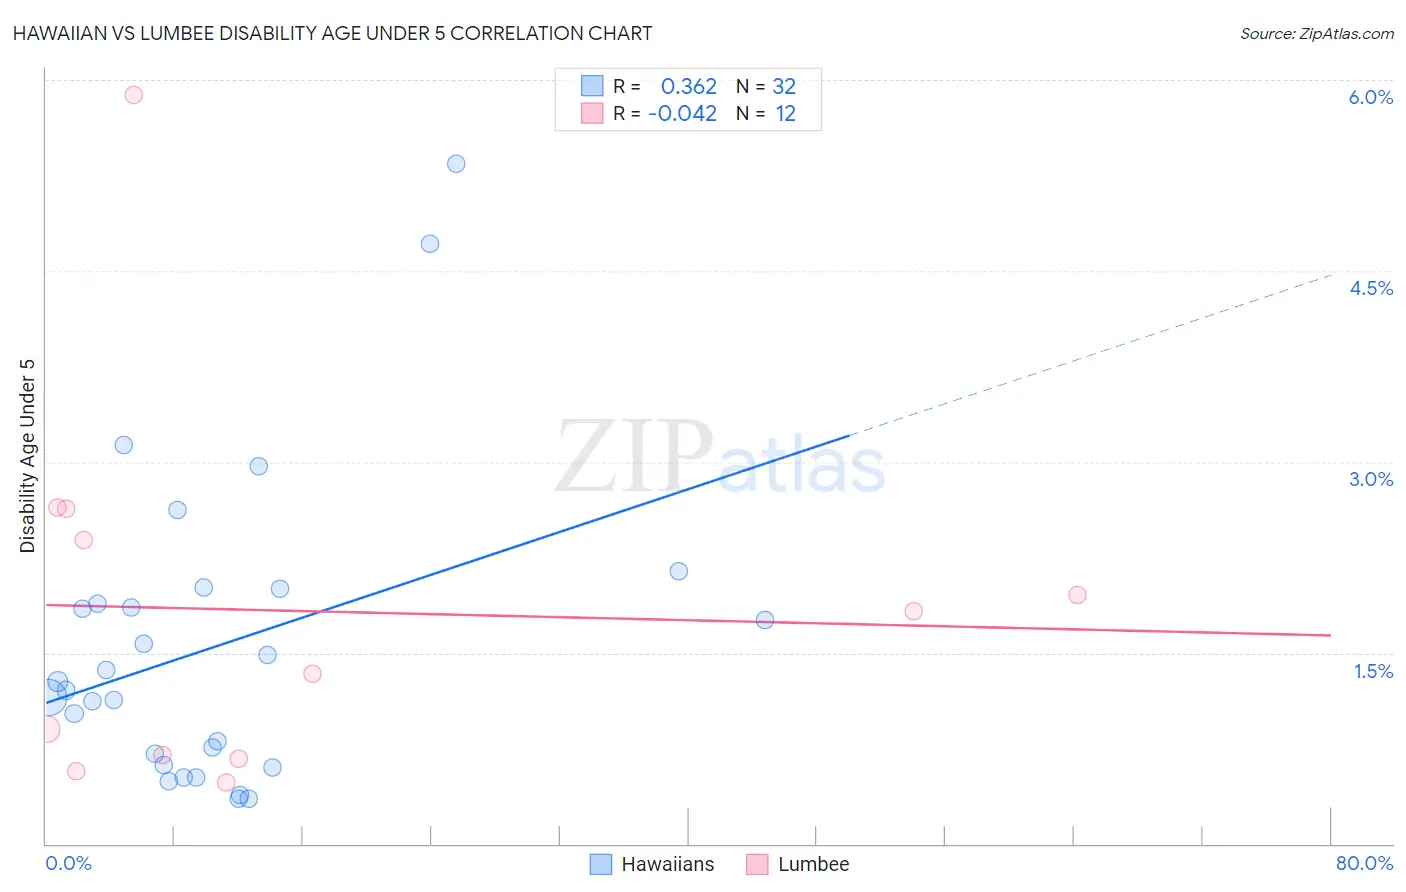
Hawaiian vs Lumbee Disability Age Under 5 Correlation Chart
The statistical analysis conducted on geographies consisting of 194,372,876 people shows a mild positive correlation between the proportion of Hawaiians and percentage of population with a disability under the age of 5 in the United States with a correlation coefficient (R) of 0.362 and weighted average of 1.2%. Similarly, the statistical analysis conducted on geographies consisting of 69,814,894 people shows no correlation between the proportion of Lumbee and percentage of population with a disability under the age of 5 in the United States with a correlation coefficient (R) of -0.042 and weighted average of 1.3%, a difference of 10.6%.
Disability Age Under 5 Correlation Summary
| Measurement | Hawaiian | Lumbee |
| Minimum | 0.35% | 0.48% |
| Maximum | 5.3% | 5.9% |
| Range | 5.0% | 5.4% |
| Mean | 1.6% | 1.8% |
| Median | 1.2% | 1.6% |
| Interquartile 25% (IQ1) | 0.66% | 0.69% |
| Interquartile 75% (IQ3) | 1.9% | 2.5% |
| Interquartile Range (IQR) | 1.3% | 1.8% |
| Standard Deviation (Sample) | 1.2% | 1.5% |
| Standard Deviation (Population) | 1.2% | 1.4% |
Similar Demographics by Disability Age Under 5
Demographics Similar to Hawaiians by Disability Age Under 5
In terms of disability age under 5, the demographic groups most similar to Hawaiians are Immigrants from Ghana (1.2%, a difference of 0.020%), Uruguayan (1.2%, a difference of 0.030%), Immigrants from Thailand (1.2%, a difference of 0.10%), Immigrants from South America (1.2%, a difference of 0.16%), and Arab (1.2%, a difference of 0.22%).
| Demographics | Rating | Rank | Disability Age Under 5 |
| Kenyans | 75.9 /100 | #149 | Good 1.2% |
| South Americans | 75.6 /100 | #150 | Good 1.2% |
| Yaqui | 74.8 /100 | #151 | Good 1.2% |
| Hondurans | 72.5 /100 | #152 | Good 1.2% |
| Immigrants | Thailand | 69.4 /100 | #153 | Good 1.2% |
| Uruguayans | 68.8 /100 | #154 | Good 1.2% |
| Immigrants | Ghana | 68.7 /100 | #155 | Good 1.2% |
| Hawaiians | 68.5 /100 | #156 | Good 1.2% |
| Immigrants | South America | 67.0 /100 | #157 | Good 1.2% |
| Arabs | 66.4 /100 | #158 | Good 1.2% |
| Colombians | 65.8 /100 | #159 | Good 1.2% |
| Immigrants | Latin America | 65.8 /100 | #160 | Good 1.2% |
| Immigrants | Africa | 65.1 /100 | #161 | Good 1.2% |
| Guatemalans | 63.6 /100 | #162 | Good 1.2% |
| Immigrants | Guatemala | 63.2 /100 | #163 | Good 1.2% |
Demographics Similar to Lumbee by Disability Age Under 5
In terms of disability age under 5, the demographic groups most similar to Lumbee are Maltese (1.3%, a difference of 0.080%), Native Hawaiian (1.3%, a difference of 0.15%), Immigrants from Austria (1.3%, a difference of 0.18%), Spanish American Indian (1.3%, a difference of 0.34%), and Immigrants from Cameroon (1.4%, a difference of 0.38%).
| Demographics | Rating | Rank | Disability Age Under 5 |
| Central American Indians | 3.6 /100 | #235 | Tragic 1.3% |
| South American Indians | 3.3 /100 | #236 | Tragic 1.3% |
| Basques | 3.0 /100 | #237 | Tragic 1.3% |
| Spanish American Indians | 2.4 /100 | #238 | Tragic 1.3% |
| Immigrants | Austria | 2.3 /100 | #239 | Tragic 1.3% |
| Native Hawaiians | 2.2 /100 | #240 | Tragic 1.3% |
| Maltese | 2.2 /100 | #241 | Tragic 1.3% |
| Lumbee | 2.1 /100 | #242 | Tragic 1.3% |
| Immigrants | Cameroon | 1.7 /100 | #243 | Tragic 1.4% |
| Spaniards | 1.4 /100 | #244 | Tragic 1.4% |
| Potawatomi | 1.1 /100 | #245 | Tragic 1.4% |
| Russians | 1.0 /100 | #246 | Tragic 1.4% |
| Immigrants | England | 1.0 /100 | #247 | Tragic 1.4% |
| Eastern Europeans | 1.0 /100 | #248 | Tragic 1.4% |
| Bermudans | 1.0 /100 | #249 | Tragic 1.4% |