Ethiopian vs Lumbee Disability Age Under 5
COMPARE
Ethiopian
Lumbee
Disability Age Under 5
Disability Age Under 5 Comparison
Ethiopians
Lumbee
1.1%
DISABILITY AGE UNDER 5
97.2/ 100
METRIC RATING
89th/ 347
METRIC RANK
1.3%
DISABILITY AGE UNDER 5
2.1/ 100
METRIC RATING
242nd/ 347
METRIC RANK
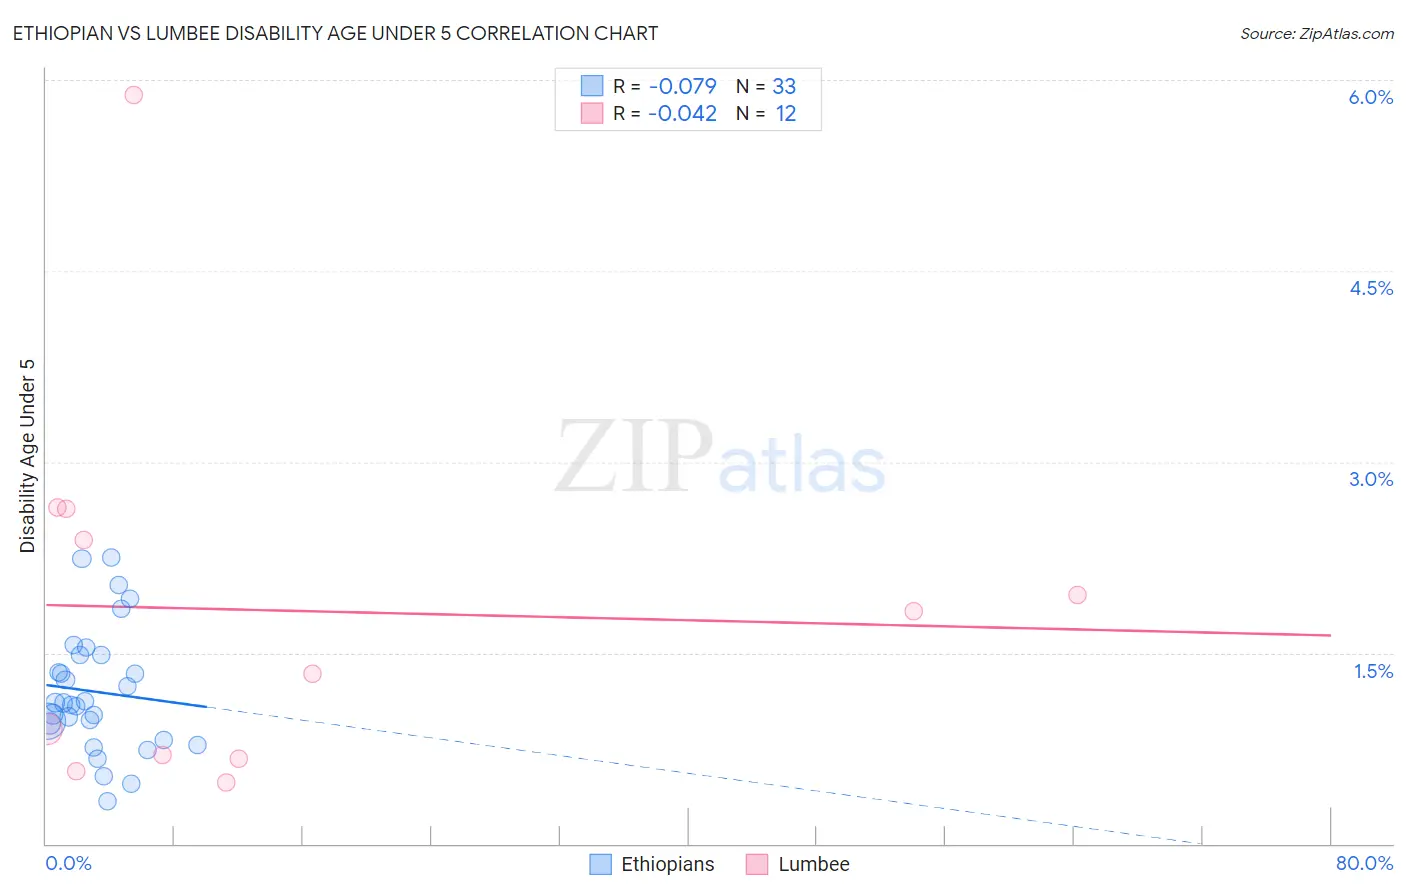
Ethiopian vs Lumbee Disability Age Under 5 Correlation Chart
The statistical analysis conducted on geographies consisting of 145,731,727 people shows a slight negative correlation between the proportion of Ethiopians and percentage of population with a disability under the age of 5 in the United States with a correlation coefficient (R) of -0.079 and weighted average of 1.1%. Similarly, the statistical analysis conducted on geographies consisting of 69,814,894 people shows no correlation between the proportion of Lumbee and percentage of population with a disability under the age of 5 in the United States with a correlation coefficient (R) of -0.042 and weighted average of 1.3%, a difference of 18.2%.
Disability Age Under 5 Correlation Summary
| Measurement | Ethiopian | Lumbee |
| Minimum | 0.34% | 0.48% |
| Maximum | 2.3% | 5.9% |
| Range | 1.9% | 5.4% |
| Mean | 1.2% | 1.8% |
| Median | 1.1% | 1.6% |
| Interquartile 25% (IQ1) | 0.88% | 0.69% |
| Interquartile 75% (IQ3) | 1.5% | 2.5% |
| Interquartile Range (IQR) | 0.60% | 1.8% |
| Standard Deviation (Sample) | 0.48% | 1.5% |
| Standard Deviation (Population) | 0.47% | 1.4% |
Similar Demographics by Disability Age Under 5
Demographics Similar to Ethiopians by Disability Age Under 5
In terms of disability age under 5, the demographic groups most similar to Ethiopians are Chinese (1.1%, a difference of 0.030%), Albanian (1.1%, a difference of 0.070%), Immigrants from Cuba (1.1%, a difference of 0.24%), Spanish American (1.1%, a difference of 0.27%), and Immigrants from Dominican Republic (1.1%, a difference of 0.28%).
| Demographics | Rating | Rank | Disability Age Under 5 |
| Immigrants | Jordan | 97.9 /100 | #82 | Exceptional 1.1% |
| Immigrants | Syria | 97.9 /100 | #83 | Exceptional 1.1% |
| Immigrants | Zaire | 97.8 /100 | #84 | Exceptional 1.1% |
| Sudanese | 97.7 /100 | #85 | Exceptional 1.1% |
| Okinawans | 97.6 /100 | #86 | Exceptional 1.1% |
| Ugandans | 97.5 /100 | #87 | Exceptional 1.1% |
| Immigrants | Dominican Republic | 97.5 /100 | #88 | Exceptional 1.1% |
| Ethiopians | 97.2 /100 | #89 | Exceptional 1.1% |
| Chinese | 97.2 /100 | #90 | Exceptional 1.1% |
| Albanians | 97.2 /100 | #91 | Exceptional 1.1% |
| Immigrants | Cuba | 97.0 /100 | #92 | Exceptional 1.1% |
| Spanish Americans | 96.9 /100 | #93 | Exceptional 1.1% |
| Sri Lankans | 96.8 /100 | #94 | Exceptional 1.1% |
| Immigrants | Moldova | 96.8 /100 | #95 | Exceptional 1.1% |
| Mongolians | 96.6 /100 | #96 | Exceptional 1.1% |
Demographics Similar to Lumbee by Disability Age Under 5
In terms of disability age under 5, the demographic groups most similar to Lumbee are Maltese (1.3%, a difference of 0.080%), Native Hawaiian (1.3%, a difference of 0.15%), Immigrants from Austria (1.3%, a difference of 0.18%), Spanish American Indian (1.3%, a difference of 0.34%), and Immigrants from Cameroon (1.4%, a difference of 0.38%).
| Demographics | Rating | Rank | Disability Age Under 5 |
| Central American Indians | 3.6 /100 | #235 | Tragic 1.3% |
| South American Indians | 3.3 /100 | #236 | Tragic 1.3% |
| Basques | 3.0 /100 | #237 | Tragic 1.3% |
| Spanish American Indians | 2.4 /100 | #238 | Tragic 1.3% |
| Immigrants | Austria | 2.3 /100 | #239 | Tragic 1.3% |
| Native Hawaiians | 2.2 /100 | #240 | Tragic 1.3% |
| Maltese | 2.2 /100 | #241 | Tragic 1.3% |
| Lumbee | 2.1 /100 | #242 | Tragic 1.3% |
| Immigrants | Cameroon | 1.7 /100 | #243 | Tragic 1.4% |
| Spaniards | 1.4 /100 | #244 | Tragic 1.4% |
| Potawatomi | 1.1 /100 | #245 | Tragic 1.4% |
| Russians | 1.0 /100 | #246 | Tragic 1.4% |
| Immigrants | England | 1.0 /100 | #247 | Tragic 1.4% |
| Eastern Europeans | 1.0 /100 | #248 | Tragic 1.4% |
| Bermudans | 1.0 /100 | #249 | Tragic 1.4% |