Salvadoran vs Lumbee Disability Age Under 5
COMPARE
Salvadoran
Lumbee
Disability Age Under 5
Disability Age Under 5 Comparison
Salvadorans
Lumbee
1.1%
DISABILITY AGE UNDER 5
99.5/ 100
METRIC RATING
55th/ 347
METRIC RANK
1.3%
DISABILITY AGE UNDER 5
2.1/ 100
METRIC RATING
242nd/ 347
METRIC RANK
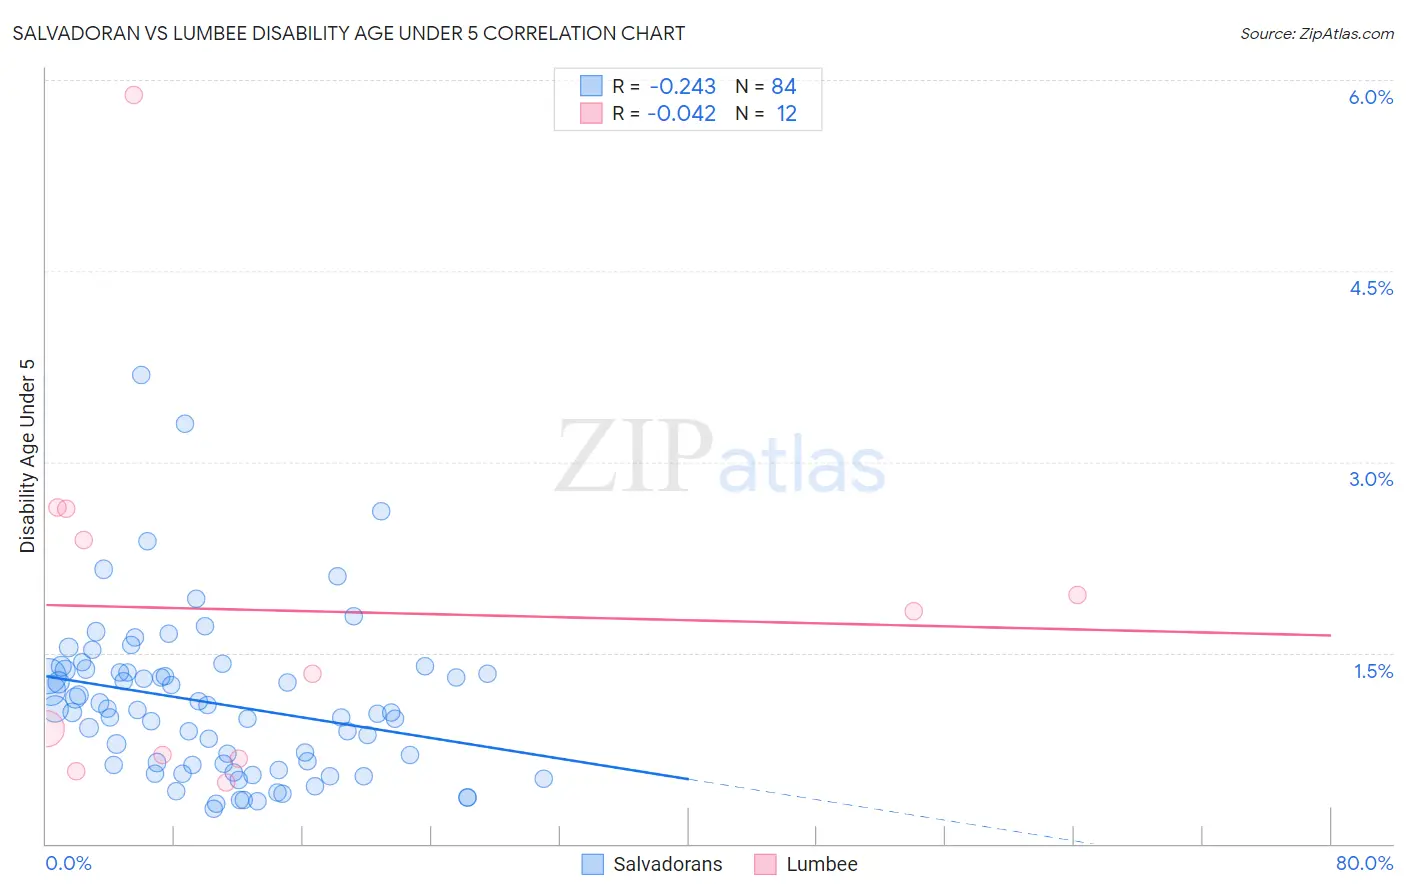
Salvadoran vs Lumbee Disability Age Under 5 Correlation Chart
The statistical analysis conducted on geographies consisting of 220,785,812 people shows a weak negative correlation between the proportion of Salvadorans and percentage of population with a disability under the age of 5 in the United States with a correlation coefficient (R) of -0.243 and weighted average of 1.1%. Similarly, the statistical analysis conducted on geographies consisting of 69,814,894 people shows no correlation between the proportion of Lumbee and percentage of population with a disability under the age of 5 in the United States with a correlation coefficient (R) of -0.042 and weighted average of 1.3%, a difference of 23.8%.
Disability Age Under 5 Correlation Summary
| Measurement | Salvadoran | Lumbee |
| Minimum | 0.27% | 0.48% |
| Maximum | 3.7% | 5.9% |
| Range | 3.4% | 5.4% |
| Mean | 1.1% | 1.8% |
| Median | 1.0% | 1.6% |
| Interquartile 25% (IQ1) | 0.62% | 0.69% |
| Interquartile 75% (IQ3) | 1.4% | 2.5% |
| Interquartile Range (IQR) | 0.74% | 1.8% |
| Standard Deviation (Sample) | 0.63% | 1.5% |
| Standard Deviation (Population) | 0.62% | 1.4% |
Similar Demographics by Disability Age Under 5
Demographics Similar to Salvadorans by Disability Age Under 5
In terms of disability age under 5, the demographic groups most similar to Salvadorans are Immigrants from El Salvador (1.1%, a difference of 0.090%), Asian (1.1%, a difference of 0.38%), Ecuadorian (1.1%, a difference of 0.39%), Assyrian/Chaldean/Syriac (1.1%, a difference of 0.42%), and Immigrants from Egypt (1.1%, a difference of 0.61%).
| Demographics | Rating | Rank | Disability Age Under 5 |
| Immigrants | Singapore | 99.7 /100 | #48 | Exceptional 1.1% |
| Immigrants | Russia | 99.7 /100 | #49 | Exceptional 1.1% |
| Immigrants | Japan | 99.7 /100 | #50 | Exceptional 1.1% |
| Immigrants | Kazakhstan | 99.7 /100 | #51 | Exceptional 1.1% |
| Immigrants | Bolivia | 99.6 /100 | #52 | Exceptional 1.1% |
| Asians | 99.6 /100 | #53 | Exceptional 1.1% |
| Immigrants | El Salvador | 99.6 /100 | #54 | Exceptional 1.1% |
| Salvadorans | 99.5 /100 | #55 | Exceptional 1.1% |
| Ecuadorians | 99.5 /100 | #56 | Exceptional 1.1% |
| Assyrians/Chaldeans/Syriacs | 99.5 /100 | #57 | Exceptional 1.1% |
| Immigrants | Egypt | 99.4 /100 | #58 | Exceptional 1.1% |
| Immigrants | Malaysia | 99.4 /100 | #59 | Exceptional 1.1% |
| Immigrants | Western Asia | 99.2 /100 | #60 | Exceptional 1.1% |
| Immigrants | Ethiopia | 99.2 /100 | #61 | Exceptional 1.1% |
| Immigrants | Switzerland | 99.2 /100 | #62 | Exceptional 1.1% |
Demographics Similar to Lumbee by Disability Age Under 5
In terms of disability age under 5, the demographic groups most similar to Lumbee are Maltese (1.3%, a difference of 0.080%), Native Hawaiian (1.3%, a difference of 0.15%), Immigrants from Austria (1.3%, a difference of 0.18%), Spanish American Indian (1.3%, a difference of 0.34%), and Immigrants from Cameroon (1.4%, a difference of 0.38%).
| Demographics | Rating | Rank | Disability Age Under 5 |
| Central American Indians | 3.6 /100 | #235 | Tragic 1.3% |
| South American Indians | 3.3 /100 | #236 | Tragic 1.3% |
| Basques | 3.0 /100 | #237 | Tragic 1.3% |
| Spanish American Indians | 2.4 /100 | #238 | Tragic 1.3% |
| Immigrants | Austria | 2.3 /100 | #239 | Tragic 1.3% |
| Native Hawaiians | 2.2 /100 | #240 | Tragic 1.3% |
| Maltese | 2.2 /100 | #241 | Tragic 1.3% |
| Lumbee | 2.1 /100 | #242 | Tragic 1.3% |
| Immigrants | Cameroon | 1.7 /100 | #243 | Tragic 1.4% |
| Spaniards | 1.4 /100 | #244 | Tragic 1.4% |
| Potawatomi | 1.1 /100 | #245 | Tragic 1.4% |
| Russians | 1.0 /100 | #246 | Tragic 1.4% |
| Immigrants | England | 1.0 /100 | #247 | Tragic 1.4% |
| Eastern Europeans | 1.0 /100 | #248 | Tragic 1.4% |
| Bermudans | 1.0 /100 | #249 | Tragic 1.4% |