Panamanian vs Kiowa Disability Age 65 to 74
COMPARE
Panamanian
Kiowa
Disability Age 65 to 74
Disability Age 65 to 74 Comparison
Panamanians
Kiowa
24.4%
DISABILITY AGE 65 TO 74
4.2/ 100
METRIC RATING
234th/ 347
METRIC RANK
32.6%
DISABILITY AGE 65 TO 74
0.0/ 100
METRIC RATING
339th/ 347
METRIC RANK
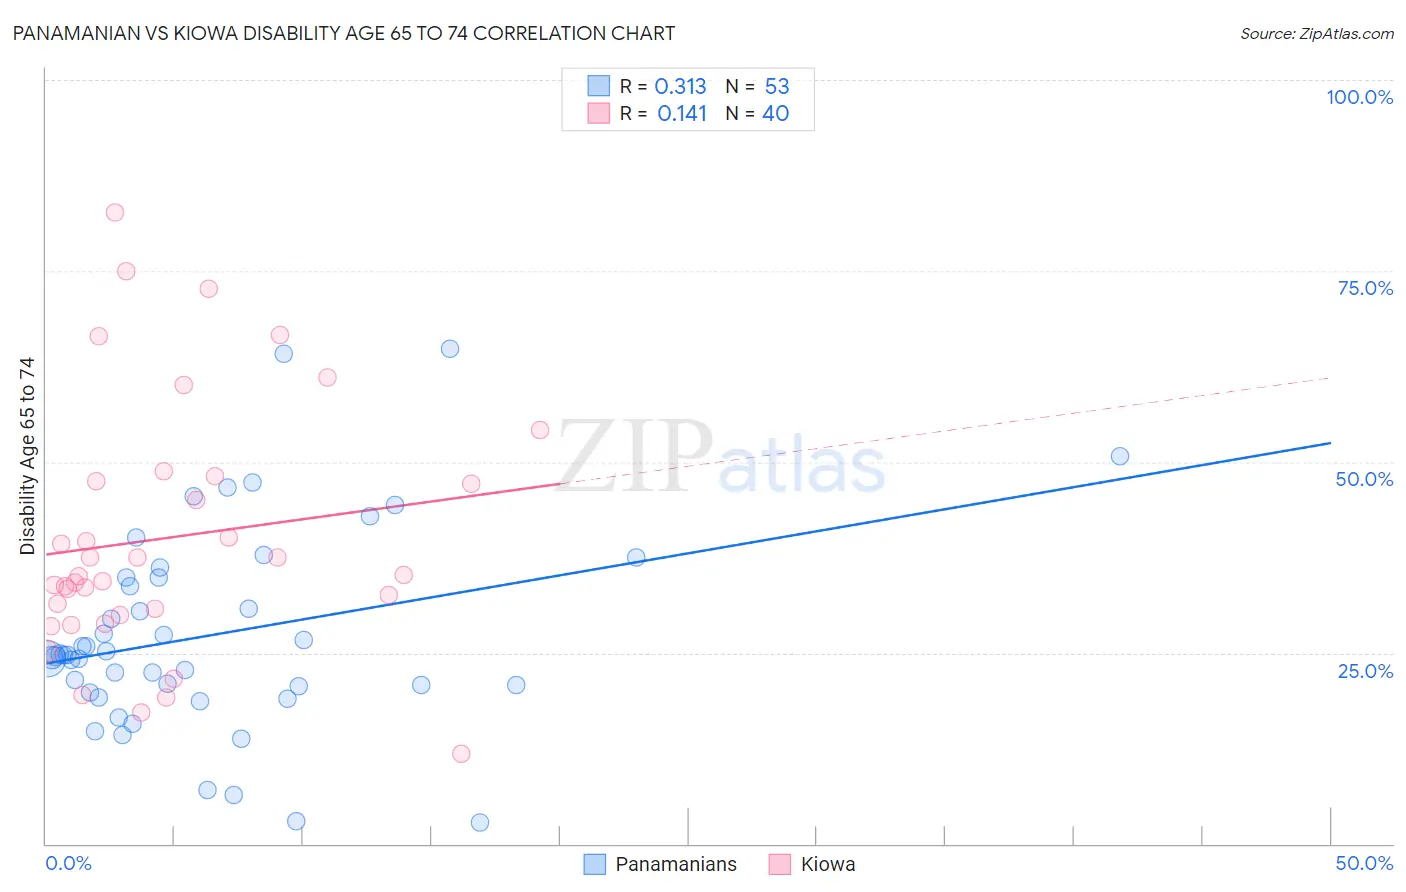
Panamanian vs Kiowa Disability Age 65 to 74 Correlation Chart
The statistical analysis conducted on geographies consisting of 280,720,720 people shows a mild positive correlation between the proportion of Panamanians and percentage of population with a disability between the ages 65 and 75 in the United States with a correlation coefficient (R) of 0.313 and weighted average of 24.4%. Similarly, the statistical analysis conducted on geographies consisting of 56,067,785 people shows a poor positive correlation between the proportion of Kiowa and percentage of population with a disability between the ages 65 and 75 in the United States with a correlation coefficient (R) of 0.141 and weighted average of 32.6%, a difference of 33.4%.
Disability Age 65 to 74 Correlation Summary
| Measurement | Panamanian | Kiowa |
| Minimum | 2.9% | 11.7% |
| Maximum | 64.9% | 82.6% |
| Range | 62.0% | 70.9% |
| Mean | 27.4% | 40.1% |
| Median | 24.7% | 35.1% |
| Interquartile 25% (IQ1) | 20.3% | 30.3% |
| Interquartile 75% (IQ3) | 34.9% | 47.7% |
| Interquartile Range (IQR) | 14.6% | 17.4% |
| Standard Deviation (Sample) | 13.2% | 16.5% |
| Standard Deviation (Population) | 13.0% | 16.3% |
Similar Demographics by Disability Age 65 to 74
Demographics Similar to Panamanians by Disability Age 65 to 74
In terms of disability age 65 to 74, the demographic groups most similar to Panamanians are Bahamian (24.4%, a difference of 0.11%), Scotch-Irish (24.4%, a difference of 0.16%), German Russian (24.4%, a difference of 0.19%), Immigrants from Zaire (24.3%, a difference of 0.27%), and West Indian (24.5%, a difference of 0.29%).
| Demographics | Rating | Rank | Disability Age 65 to 74 |
| Nigerians | 7.8 /100 | #227 | Tragic 24.2% |
| Whites/Caucasians | 6.6 /100 | #228 | Tragic 24.2% |
| Celtics | 6.4 /100 | #229 | Tragic 24.2% |
| Barbadians | 6.0 /100 | #230 | Tragic 24.3% |
| Immigrants | Thailand | 5.2 /100 | #231 | Tragic 24.3% |
| Immigrants | Zaire | 5.0 /100 | #232 | Tragic 24.3% |
| Bahamians | 4.5 /100 | #233 | Tragic 24.4% |
| Panamanians | 4.2 /100 | #234 | Tragic 24.4% |
| Scotch-Irish | 3.8 /100 | #235 | Tragic 24.4% |
| German Russians | 3.7 /100 | #236 | Tragic 24.4% |
| West Indians | 3.4 /100 | #237 | Tragic 24.5% |
| Immigrants | Ghana | 3.0 /100 | #238 | Tragic 24.5% |
| Immigrants | Caribbean | 2.6 /100 | #239 | Tragic 24.6% |
| Spaniards | 2.4 /100 | #240 | Tragic 24.6% |
| Immigrants | Western Africa | 2.3 /100 | #241 | Tragic 24.6% |
Demographics Similar to Kiowa by Disability Age 65 to 74
In terms of disability age 65 to 74, the demographic groups most similar to Kiowa are Lumbee (32.7%, a difference of 0.52%), Alaskan Athabascan (32.4%, a difference of 0.62%), Houma (32.3%, a difference of 0.81%), Tsimshian (32.9%, a difference of 1.1%), and Pueblo (33.1%, a difference of 1.7%).
| Demographics | Rating | Rank | Disability Age 65 to 74 |
| Natives/Alaskans | 0.0 /100 | #332 | Tragic 30.4% |
| Colville | 0.0 /100 | #333 | Tragic 30.5% |
| Alaska Natives | 0.0 /100 | #334 | Tragic 30.6% |
| Cheyenne | 0.0 /100 | #335 | Tragic 31.1% |
| Yuman | 0.0 /100 | #336 | Tragic 31.5% |
| Houma | 0.0 /100 | #337 | Tragic 32.3% |
| Alaskan Athabascans | 0.0 /100 | #338 | Tragic 32.4% |
| Kiowa | 0.0 /100 | #339 | Tragic 32.6% |
| Lumbee | 0.0 /100 | #340 | Tragic 32.7% |
| Tsimshian | 0.0 /100 | #341 | Tragic 32.9% |
| Pueblo | 0.0 /100 | #342 | Tragic 33.1% |
| Navajo | 0.0 /100 | #343 | Tragic 33.3% |
| Inupiat | 0.0 /100 | #344 | Tragic 34.5% |
| Tohono O'odham | 0.0 /100 | #345 | Tragic 36.0% |
| Yup'ik | 0.0 /100 | #346 | Tragic 37.8% |