Panamanian vs Nonimmigrants Disability Age 65 to 74
COMPARE
Panamanian
Nonimmigrants
Disability Age 65 to 74
Disability Age 65 to 74 Comparison
Panamanians
Nonimmigrants
24.4%
DISABILITY AGE 65 TO 74
4.2/ 100
METRIC RATING
234th/ 347
METRIC RANK
25.0%
DISABILITY AGE 65 TO 74
0.7/ 100
METRIC RATING
251st/ 347
METRIC RANK
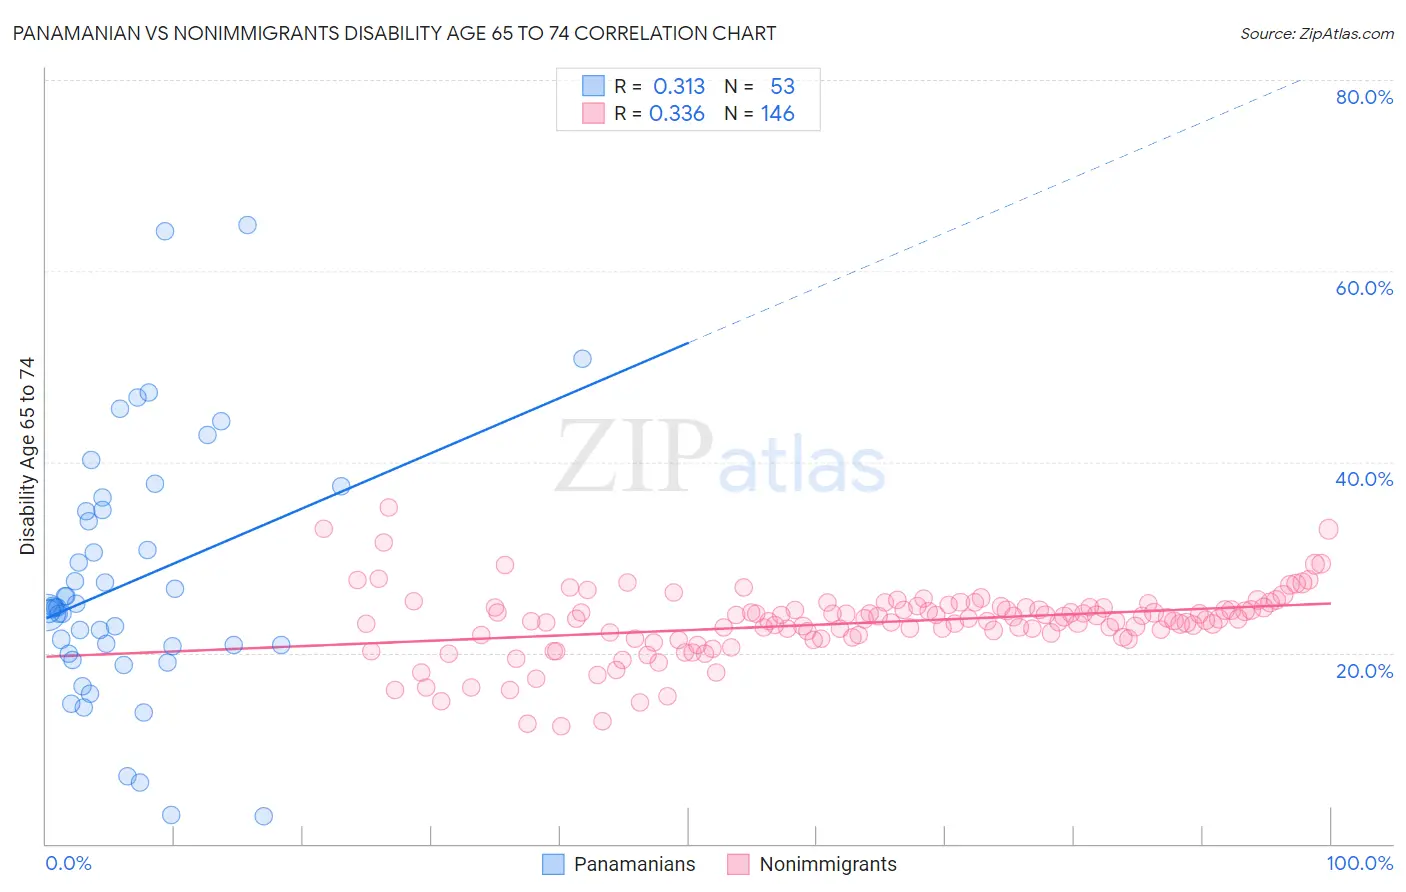
Panamanian vs Nonimmigrants Disability Age 65 to 74 Correlation Chart
The statistical analysis conducted on geographies consisting of 280,720,720 people shows a mild positive correlation between the proportion of Panamanians and percentage of population with a disability between the ages 65 and 75 in the United States with a correlation coefficient (R) of 0.313 and weighted average of 24.4%. Similarly, the statistical analysis conducted on geographies consisting of 581,657,399 people shows a mild positive correlation between the proportion of Nonimmigrants and percentage of population with a disability between the ages 65 and 75 in the United States with a correlation coefficient (R) of 0.336 and weighted average of 25.0%, a difference of 2.5%.
Disability Age 65 to 74 Correlation Summary
| Measurement | Panamanian | Nonimmigrants |
| Minimum | 2.9% | 12.3% |
| Maximum | 64.9% | 35.2% |
| Range | 62.0% | 22.8% |
| Mean | 27.4% | 23.1% |
| Median | 24.7% | 23.5% |
| Interquartile 25% (IQ1) | 20.3% | 21.7% |
| Interquartile 75% (IQ3) | 34.9% | 24.8% |
| Interquartile Range (IQR) | 14.6% | 3.1% |
| Standard Deviation (Sample) | 13.2% | 3.6% |
| Standard Deviation (Population) | 13.0% | 3.6% |
Demographics Similar to Panamanians and Nonimmigrants by Disability Age 65 to 74
In terms of disability age 65 to 74, the demographic groups most similar to Panamanians are Bahamian (24.4%, a difference of 0.11%), Scotch-Irish (24.4%, a difference of 0.16%), German Russian (24.4%, a difference of 0.19%), Immigrants from Zaire (24.3%, a difference of 0.27%), and West Indian (24.5%, a difference of 0.29%). Similarly, the demographic groups most similar to Nonimmigrants are Immigrants from El Salvador (25.1%, a difference of 0.19%), Salvadoran (25.0%, a difference of 0.20%), Immigrants from Fiji (25.0%, a difference of 0.22%), Senegalese (24.9%, a difference of 0.32%), and Indonesian (24.9%, a difference of 0.57%).
| Demographics | Rating | Rank | Disability Age 65 to 74 |
| Immigrants | Zaire | 5.0 /100 | #232 | Tragic 24.3% |
| Bahamians | 4.5 /100 | #233 | Tragic 24.4% |
| Panamanians | 4.2 /100 | #234 | Tragic 24.4% |
| Scotch-Irish | 3.8 /100 | #235 | Tragic 24.4% |
| German Russians | 3.7 /100 | #236 | Tragic 24.4% |
| West Indians | 3.4 /100 | #237 | Tragic 24.5% |
| Immigrants | Ghana | 3.0 /100 | #238 | Tragic 24.5% |
| Immigrants | Caribbean | 2.6 /100 | #239 | Tragic 24.6% |
| Spaniards | 2.4 /100 | #240 | Tragic 24.6% |
| Immigrants | Western Africa | 2.3 /100 | #241 | Tragic 24.6% |
| Immigrants | Senegal | 2.2 /100 | #242 | Tragic 24.6% |
| Spanish | 2.2 /100 | #243 | Tragic 24.6% |
| Armenians | 2.0 /100 | #244 | Tragic 24.7% |
| British West Indians | 2.0 /100 | #245 | Tragic 24.7% |
| Immigrants | Iraq | 1.9 /100 | #246 | Tragic 24.7% |
| Indonesians | 1.1 /100 | #247 | Tragic 24.9% |
| Senegalese | 0.9 /100 | #248 | Tragic 24.9% |
| Immigrants | Fiji | 0.8 /100 | #249 | Tragic 25.0% |
| Salvadorans | 0.8 /100 | #250 | Tragic 25.0% |
| Immigrants | Nonimmigrants | 0.7 /100 | #251 | Tragic 25.0% |
| Immigrants | El Salvador | 0.6 /100 | #252 | Tragic 25.1% |