Panamanian vs Kiowa Male Unemployment
COMPARE
Panamanian
Kiowa
Male Unemployment
Male Unemployment Comparison
Panamanians
Kiowa
5.6%
MALE UNEMPLOYMENT
1.9/ 100
METRIC RATING
225th/ 347
METRIC RANK
5.8%
MALE UNEMPLOYMENT
0.2/ 100
METRIC RATING
255th/ 347
METRIC RANK
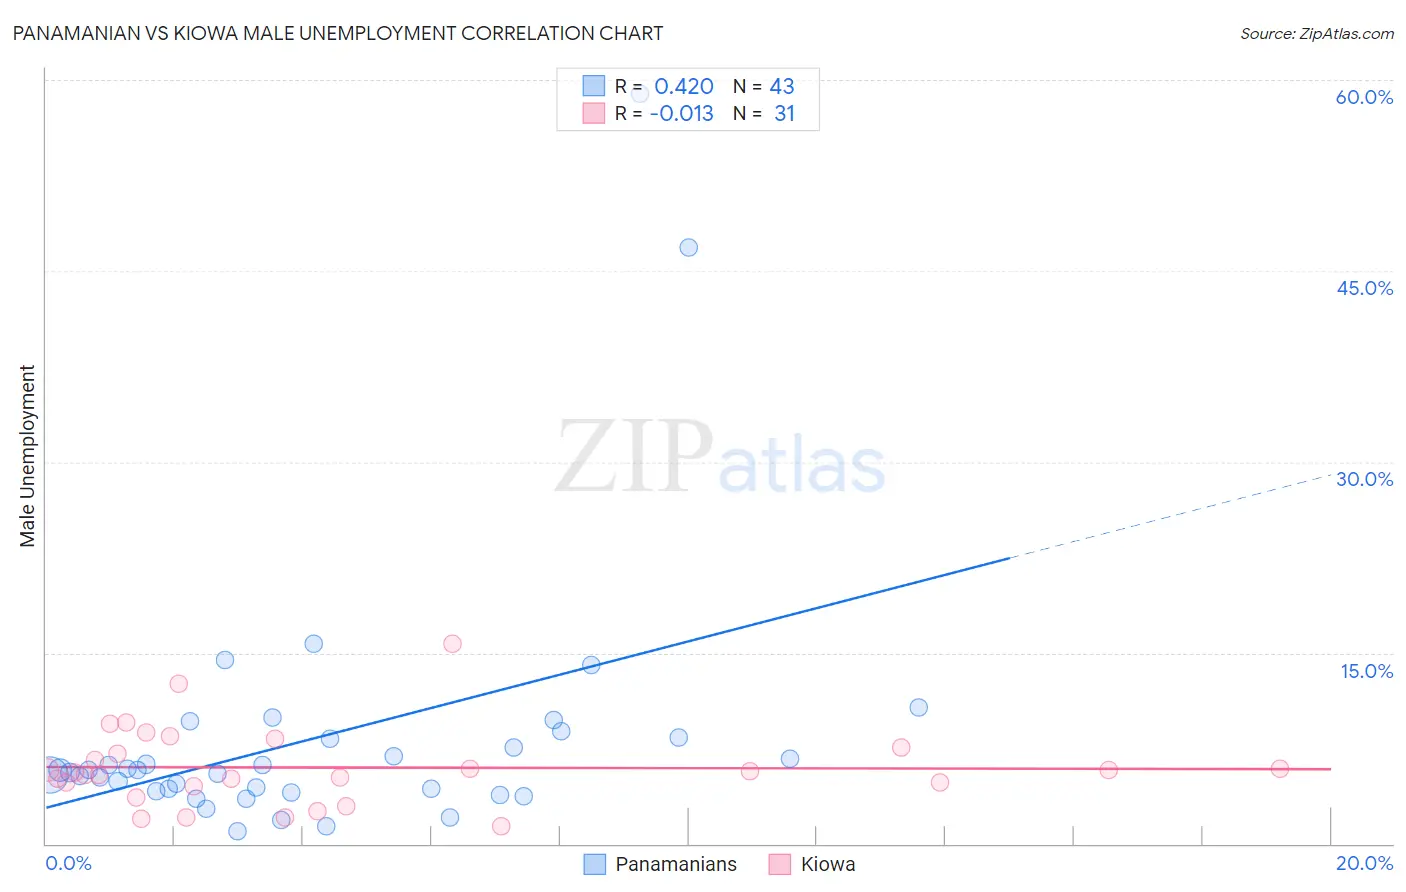
Panamanian vs Kiowa Male Unemployment Correlation Chart
The statistical analysis conducted on geographies consisting of 280,561,708 people shows a moderate positive correlation between the proportion of Panamanians and unemployment rate among males in the United States with a correlation coefficient (R) of 0.420 and weighted average of 5.6%. Similarly, the statistical analysis conducted on geographies consisting of 56,015,604 people shows no correlation between the proportion of Kiowa and unemployment rate among males in the United States with a correlation coefficient (R) of -0.013 and weighted average of 5.8%, a difference of 3.4%.
Male Unemployment Correlation Summary
| Measurement | Panamanian | Kiowa |
| Minimum | 1.0% | 1.4% |
| Maximum | 58.9% | 15.7% |
| Range | 57.9% | 14.3% |
| Mean | 8.4% | 6.0% |
| Median | 5.8% | 5.6% |
| Interquartile 25% (IQ1) | 4.2% | 4.5% |
| Interquartile 75% (IQ3) | 8.3% | 7.6% |
| Interquartile Range (IQR) | 4.1% | 3.1% |
| Standard Deviation (Sample) | 10.5% | 3.1% |
| Standard Deviation (Population) | 10.4% | 3.0% |
Similar Demographics by Male Unemployment
Demographics Similar to Panamanians by Male Unemployment
In terms of male unemployment, the demographic groups most similar to Panamanians are Immigrants from Cambodia (5.6%, a difference of 0.090%), Immigrants from Panama (5.6%, a difference of 0.090%), Seminole (5.6%, a difference of 0.11%), Central American (5.6%, a difference of 0.11%), and Immigrants from Africa (5.6%, a difference of 0.15%).
| Demographics | Rating | Rank | Male Unemployment |
| Immigrants | Albania | 3.6 /100 | #218 | Tragic 5.5% |
| Immigrants | Western Asia | 3.5 /100 | #219 | Tragic 5.6% |
| Portuguese | 3.5 /100 | #220 | Tragic 5.6% |
| Soviet Union | 3.2 /100 | #221 | Tragic 5.6% |
| Immigrants | Micronesia | 2.9 /100 | #222 | Tragic 5.6% |
| Creek | 2.6 /100 | #223 | Tragic 5.6% |
| Cherokee | 2.4 /100 | #224 | Tragic 5.6% |
| Panamanians | 1.9 /100 | #225 | Tragic 5.6% |
| Immigrants | Cambodia | 1.8 /100 | #226 | Tragic 5.6% |
| Immigrants | Panama | 1.8 /100 | #227 | Tragic 5.6% |
| Seminole | 1.8 /100 | #228 | Tragic 5.6% |
| Central Americans | 1.8 /100 | #229 | Tragic 5.6% |
| Immigrants | Africa | 1.7 /100 | #230 | Tragic 5.6% |
| Choctaw | 1.6 /100 | #231 | Tragic 5.6% |
| Moroccans | 1.6 /100 | #232 | Tragic 5.6% |
Demographics Similar to Kiowa by Male Unemployment
In terms of male unemployment, the demographic groups most similar to Kiowa are Comanche (5.8%, a difference of 0.080%), Japanese (5.8%, a difference of 0.10%), Hispanic or Latino (5.8%, a difference of 0.25%), Mexican American Indian (5.8%, a difference of 0.28%), and Dutch West Indian (5.8%, a difference of 0.38%).
| Demographics | Rating | Rank | Male Unemployment |
| Marshallese | 0.5 /100 | #248 | Tragic 5.7% |
| Cree | 0.4 /100 | #249 | Tragic 5.7% |
| Immigrants | Bahamas | 0.4 /100 | #250 | Tragic 5.7% |
| Spanish Americans | 0.3 /100 | #251 | Tragic 5.7% |
| Mexicans | 0.2 /100 | #252 | Tragic 5.8% |
| Mexican American Indians | 0.2 /100 | #253 | Tragic 5.8% |
| Japanese | 0.2 /100 | #254 | Tragic 5.8% |
| Kiowa | 0.2 /100 | #255 | Tragic 5.8% |
| Comanche | 0.2 /100 | #256 | Tragic 5.8% |
| Hispanics or Latinos | 0.1 /100 | #257 | Tragic 5.8% |
| Dutch West Indians | 0.1 /100 | #258 | Tragic 5.8% |
| Cajuns | 0.1 /100 | #259 | Tragic 5.8% |
| Immigrants | Central America | 0.1 /100 | #260 | Tragic 5.8% |
| Liberians | 0.1 /100 | #261 | Tragic 5.8% |
| Immigrants | Portugal | 0.1 /100 | #262 | Tragic 5.9% |