Seminole vs Kiowa Disability Age 65 to 74
COMPARE
Seminole
Kiowa
Disability Age 65 to 74
Disability Age 65 to 74 Comparison
Seminole
Kiowa
29.4%
DISABILITY AGE 65 TO 74
0.0/ 100
METRIC RATING
324th/ 347
METRIC RANK
32.6%
DISABILITY AGE 65 TO 74
0.0/ 100
METRIC RATING
339th/ 347
METRIC RANK
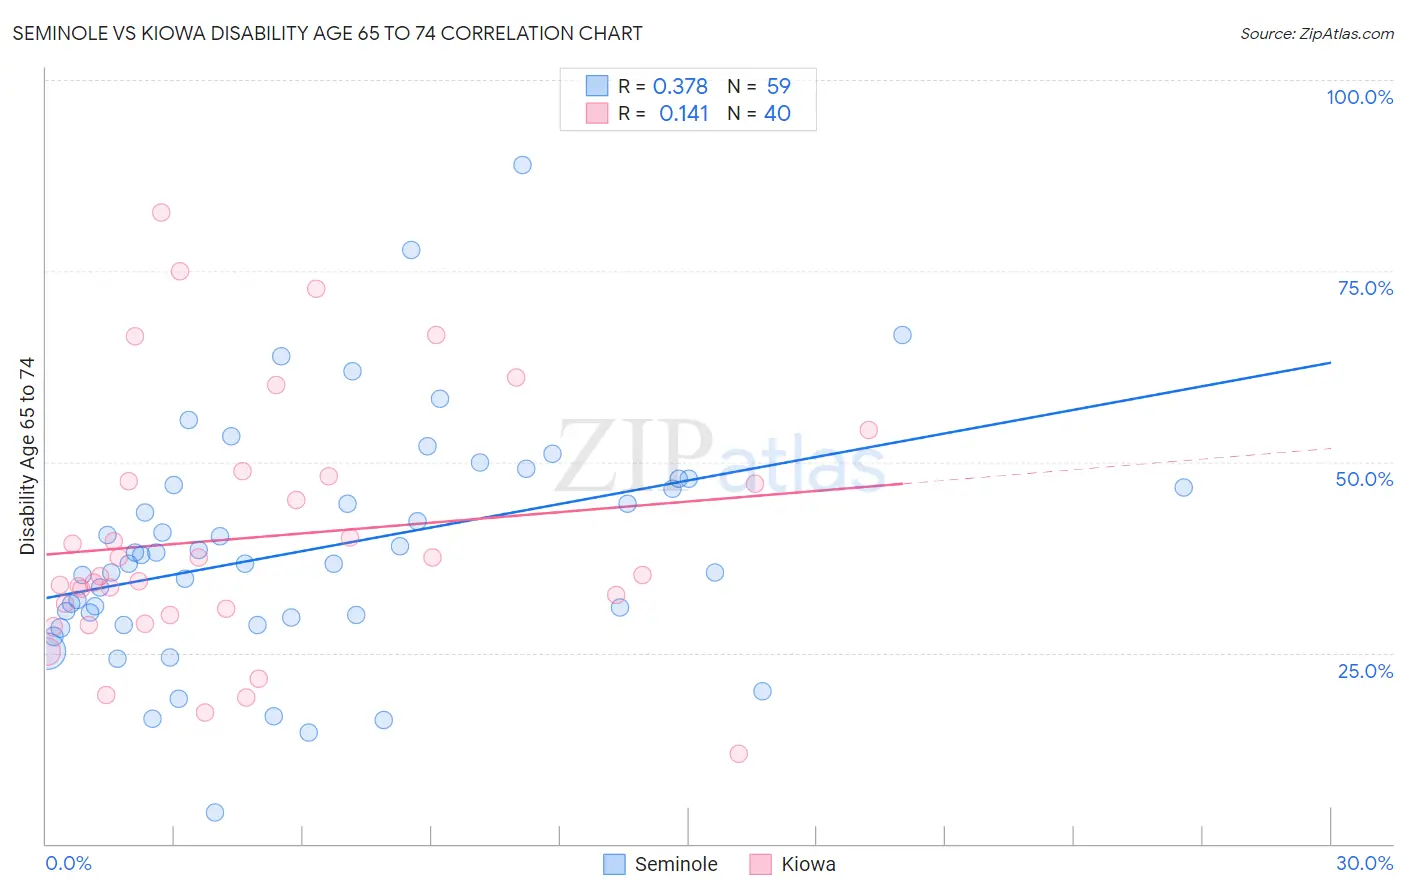
Seminole vs Kiowa Disability Age 65 to 74 Correlation Chart
The statistical analysis conducted on geographies consisting of 118,257,579 people shows a mild positive correlation between the proportion of Seminole and percentage of population with a disability between the ages 65 and 75 in the United States with a correlation coefficient (R) of 0.378 and weighted average of 29.4%. Similarly, the statistical analysis conducted on geographies consisting of 56,067,785 people shows a poor positive correlation between the proportion of Kiowa and percentage of population with a disability between the ages 65 and 75 in the United States with a correlation coefficient (R) of 0.141 and weighted average of 32.6%, a difference of 10.6%.
Disability Age 65 to 74 Correlation Summary
| Measurement | Seminole | Kiowa |
| Minimum | 4.1% | 11.7% |
| Maximum | 88.9% | 82.6% |
| Range | 84.8% | 70.9% |
| Mean | 38.6% | 40.1% |
| Median | 36.7% | 35.1% |
| Interquartile 25% (IQ1) | 29.6% | 30.3% |
| Interquartile 75% (IQ3) | 46.9% | 47.7% |
| Interquartile Range (IQR) | 17.3% | 17.4% |
| Standard Deviation (Sample) | 15.3% | 16.5% |
| Standard Deviation (Population) | 15.2% | 16.3% |
Demographics Similar to Seminole and Kiowa by Disability Age 65 to 74
In terms of disability age 65 to 74, the demographic groups most similar to Seminole are Dutch West Indian (29.6%, a difference of 0.45%), Yakama (29.6%, a difference of 0.68%), Apache (29.7%, a difference of 0.83%), Puerto Rican (29.1%, a difference of 0.97%), and Hopi (30.0%, a difference of 1.8%). Similarly, the demographic groups most similar to Kiowa are Lumbee (32.7%, a difference of 0.52%), Alaskan Athabascan (32.4%, a difference of 0.62%), Houma (32.3%, a difference of 0.81%), Tsimshian (32.9%, a difference of 1.1%), and Yuman (31.5%, a difference of 3.4%).
| Demographics | Rating | Rank | Disability Age 65 to 74 |
| Comanche | 0.0 /100 | #321 | Tragic 28.3% |
| Aleuts | 0.0 /100 | #322 | Tragic 28.4% |
| Puerto Ricans | 0.0 /100 | #323 | Tragic 29.1% |
| Seminole | 0.0 /100 | #324 | Tragic 29.4% |
| Dutch West Indians | 0.0 /100 | #325 | Tragic 29.6% |
| Yakama | 0.0 /100 | #326 | Tragic 29.6% |
| Apache | 0.0 /100 | #327 | Tragic 29.7% |
| Hopi | 0.0 /100 | #328 | Tragic 30.0% |
| Choctaw | 0.0 /100 | #329 | Tragic 30.2% |
| Creek | 0.0 /100 | #330 | Tragic 30.2% |
| Chickasaw | 0.0 /100 | #331 | Tragic 30.2% |
| Natives/Alaskans | 0.0 /100 | #332 | Tragic 30.4% |
| Colville | 0.0 /100 | #333 | Tragic 30.5% |
| Alaska Natives | 0.0 /100 | #334 | Tragic 30.6% |
| Cheyenne | 0.0 /100 | #335 | Tragic 31.1% |
| Yuman | 0.0 /100 | #336 | Tragic 31.5% |
| Houma | 0.0 /100 | #337 | Tragic 32.3% |
| Alaskan Athabascans | 0.0 /100 | #338 | Tragic 32.4% |
| Kiowa | 0.0 /100 | #339 | Tragic 32.6% |
| Lumbee | 0.0 /100 | #340 | Tragic 32.7% |
| Tsimshian | 0.0 /100 | #341 | Tragic 32.9% |