Kenyan vs Kiowa Disability Age 65 to 74
COMPARE
Kenyan
Kiowa
Disability Age 65 to 74
Disability Age 65 to 74 Comparison
Kenyans
Kiowa
23.7%
DISABILITY AGE 65 TO 74
23.2/ 100
METRIC RATING
203rd/ 347
METRIC RANK
32.6%
DISABILITY AGE 65 TO 74
0.0/ 100
METRIC RATING
339th/ 347
METRIC RANK
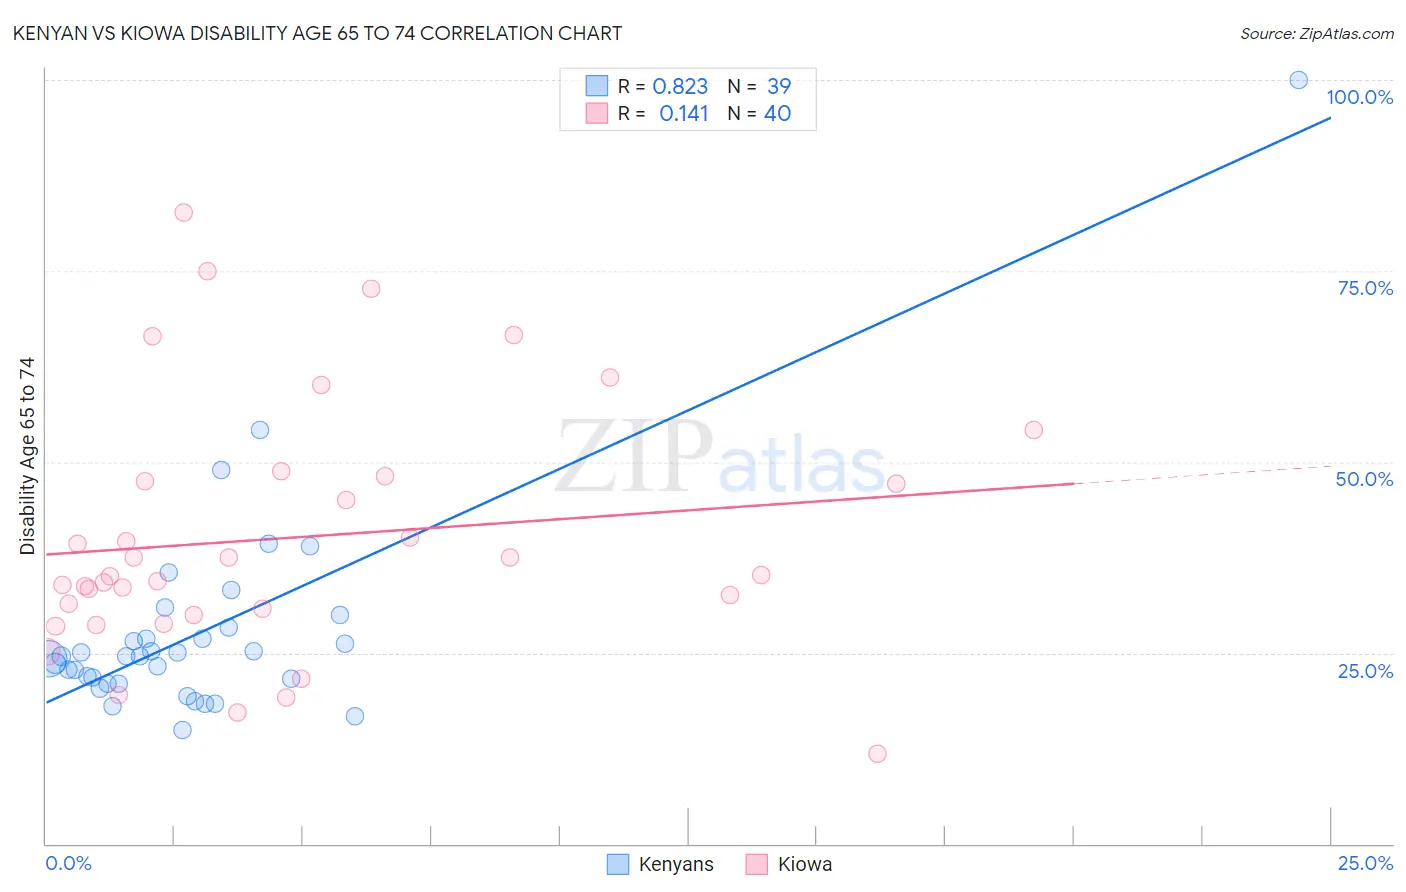
Kenyan vs Kiowa Disability Age 65 to 74 Correlation Chart
The statistical analysis conducted on geographies consisting of 167,926,566 people shows a very strong positive correlation between the proportion of Kenyans and percentage of population with a disability between the ages 65 and 75 in the United States with a correlation coefficient (R) of 0.823 and weighted average of 23.7%. Similarly, the statistical analysis conducted on geographies consisting of 56,067,785 people shows a poor positive correlation between the proportion of Kiowa and percentage of population with a disability between the ages 65 and 75 in the United States with a correlation coefficient (R) of 0.141 and weighted average of 32.6%, a difference of 37.1%.
Disability Age 65 to 74 Correlation Summary
| Measurement | Kenyan | Kiowa |
| Minimum | 14.9% | 11.7% |
| Maximum | 100.0% | 82.6% |
| Range | 85.1% | 70.9% |
| Mean | 27.9% | 40.1% |
| Median | 24.5% | 35.1% |
| Interquartile 25% (IQ1) | 20.9% | 30.3% |
| Interquartile 75% (IQ3) | 28.3% | 47.7% |
| Interquartile Range (IQR) | 7.4% | 17.4% |
| Standard Deviation (Sample) | 14.4% | 16.5% |
| Standard Deviation (Population) | 14.2% | 16.3% |
Similar Demographics by Disability Age 65 to 74
Demographics Similar to Kenyans by Disability Age 65 to 74
In terms of disability age 65 to 74, the demographic groups most similar to Kenyans are Immigrants from Bahamas (23.7%, a difference of 0.010%), Immigrants from Ecuador (23.7%, a difference of 0.050%), French Canadian (23.7%, a difference of 0.060%), Welsh (23.7%, a difference of 0.090%), and Immigrants from Grenada (23.8%, a difference of 0.090%).
| Demographics | Rating | Rank | Disability Age 65 to 74 |
| Immigrants | Trinidad and Tobago | 26.1 /100 | #196 | Fair 23.7% |
| Immigrants | Immigrants | 25.8 /100 | #197 | Fair 23.7% |
| Immigrants | Africa | 24.4 /100 | #198 | Fair 23.7% |
| Welsh | 24.3 /100 | #199 | Fair 23.7% |
| French Canadians | 24.0 /100 | #200 | Fair 23.7% |
| Immigrants | Ecuador | 23.9 /100 | #201 | Fair 23.7% |
| Immigrants | Bahamas | 23.3 /100 | #202 | Fair 23.7% |
| Kenyans | 23.2 /100 | #203 | Fair 23.7% |
| Immigrants | Grenada | 22.1 /100 | #204 | Fair 23.8% |
| Tongans | 20.8 /100 | #205 | Fair 23.8% |
| Immigrants | Jamaica | 20.7 /100 | #206 | Fair 23.8% |
| Immigrants | Sudan | 20.1 /100 | #207 | Fair 23.8% |
| Immigrants | Barbados | 19.6 /100 | #208 | Poor 23.8% |
| Immigrants | Kenya | 19.6 /100 | #209 | Poor 23.8% |
| Trinidadians and Tobagonians | 16.4 /100 | #210 | Poor 23.9% |
Demographics Similar to Kiowa by Disability Age 65 to 74
In terms of disability age 65 to 74, the demographic groups most similar to Kiowa are Lumbee (32.7%, a difference of 0.52%), Alaskan Athabascan (32.4%, a difference of 0.62%), Houma (32.3%, a difference of 0.81%), Tsimshian (32.9%, a difference of 1.1%), and Pueblo (33.1%, a difference of 1.7%).
| Demographics | Rating | Rank | Disability Age 65 to 74 |
| Natives/Alaskans | 0.0 /100 | #332 | Tragic 30.4% |
| Colville | 0.0 /100 | #333 | Tragic 30.5% |
| Alaska Natives | 0.0 /100 | #334 | Tragic 30.6% |
| Cheyenne | 0.0 /100 | #335 | Tragic 31.1% |
| Yuman | 0.0 /100 | #336 | Tragic 31.5% |
| Houma | 0.0 /100 | #337 | Tragic 32.3% |
| Alaskan Athabascans | 0.0 /100 | #338 | Tragic 32.4% |
| Kiowa | 0.0 /100 | #339 | Tragic 32.6% |
| Lumbee | 0.0 /100 | #340 | Tragic 32.7% |
| Tsimshian | 0.0 /100 | #341 | Tragic 32.9% |
| Pueblo | 0.0 /100 | #342 | Tragic 33.1% |
| Navajo | 0.0 /100 | #343 | Tragic 33.3% |
| Inupiat | 0.0 /100 | #344 | Tragic 34.5% |
| Tohono O'odham | 0.0 /100 | #345 | Tragic 36.0% |
| Yup'ik | 0.0 /100 | #346 | Tragic 37.8% |