Panamanian vs Immigrants from Sweden Disability Age 65 to 74
COMPARE
Panamanian
Immigrants from Sweden
Disability Age 65 to 74
Disability Age 65 to 74 Comparison
Panamanians
Immigrants from Sweden
24.4%
DISABILITY AGE 65 TO 74
4.2/ 100
METRIC RATING
234th/ 347
METRIC RANK
21.0%
DISABILITY AGE 65 TO 74
99.9/ 100
METRIC RATING
27th/ 347
METRIC RANK
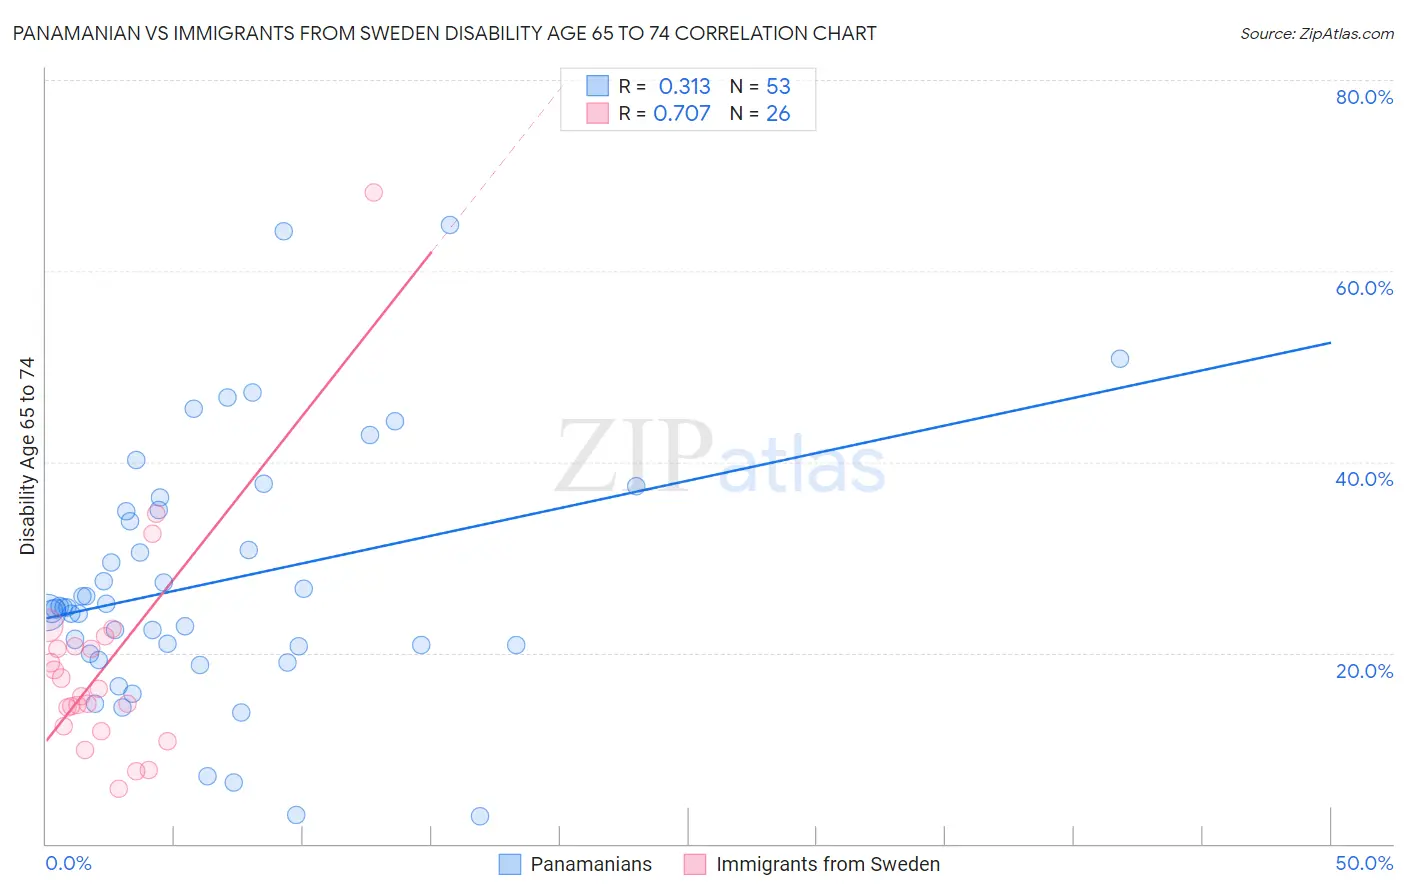
Panamanian vs Immigrants from Sweden Disability Age 65 to 74 Correlation Chart
The statistical analysis conducted on geographies consisting of 280,720,720 people shows a mild positive correlation between the proportion of Panamanians and percentage of population with a disability between the ages 65 and 75 in the United States with a correlation coefficient (R) of 0.313 and weighted average of 24.4%. Similarly, the statistical analysis conducted on geographies consisting of 164,619,095 people shows a strong positive correlation between the proportion of Immigrants from Sweden and percentage of population with a disability between the ages 65 and 75 in the United States with a correlation coefficient (R) of 0.707 and weighted average of 21.0%, a difference of 16.3%.
Disability Age 65 to 74 Correlation Summary
| Measurement | Panamanian | Immigrants from Sweden |
| Minimum | 2.9% | 5.7% |
| Maximum | 64.9% | 68.2% |
| Range | 62.0% | 62.5% |
| Mean | 27.4% | 18.8% |
| Median | 24.7% | 15.8% |
| Interquartile 25% (IQ1) | 20.3% | 12.3% |
| Interquartile 75% (IQ3) | 34.9% | 20.7% |
| Interquartile Range (IQR) | 14.6% | 8.4% |
| Standard Deviation (Sample) | 13.2% | 12.2% |
| Standard Deviation (Population) | 13.0% | 11.9% |
Similar Demographics by Disability Age 65 to 74
Demographics Similar to Panamanians by Disability Age 65 to 74
In terms of disability age 65 to 74, the demographic groups most similar to Panamanians are Bahamian (24.4%, a difference of 0.11%), Scotch-Irish (24.4%, a difference of 0.16%), German Russian (24.4%, a difference of 0.19%), Immigrants from Zaire (24.3%, a difference of 0.27%), and West Indian (24.5%, a difference of 0.29%).
| Demographics | Rating | Rank | Disability Age 65 to 74 |
| Nigerians | 7.8 /100 | #227 | Tragic 24.2% |
| Whites/Caucasians | 6.6 /100 | #228 | Tragic 24.2% |
| Celtics | 6.4 /100 | #229 | Tragic 24.2% |
| Barbadians | 6.0 /100 | #230 | Tragic 24.3% |
| Immigrants | Thailand | 5.2 /100 | #231 | Tragic 24.3% |
| Immigrants | Zaire | 5.0 /100 | #232 | Tragic 24.3% |
| Bahamians | 4.5 /100 | #233 | Tragic 24.4% |
| Panamanians | 4.2 /100 | #234 | Tragic 24.4% |
| Scotch-Irish | 3.8 /100 | #235 | Tragic 24.4% |
| German Russians | 3.7 /100 | #236 | Tragic 24.4% |
| West Indians | 3.4 /100 | #237 | Tragic 24.5% |
| Immigrants | Ghana | 3.0 /100 | #238 | Tragic 24.5% |
| Immigrants | Caribbean | 2.6 /100 | #239 | Tragic 24.6% |
| Spaniards | 2.4 /100 | #240 | Tragic 24.6% |
| Immigrants | Western Africa | 2.3 /100 | #241 | Tragic 24.6% |
Demographics Similar to Immigrants from Sweden by Disability Age 65 to 74
In terms of disability age 65 to 74, the demographic groups most similar to Immigrants from Sweden are Immigrants from Australia (21.0%, a difference of 0.020%), Bolivian (21.0%, a difference of 0.030%), Soviet Union (21.0%, a difference of 0.080%), Immigrants from Czechoslovakia (21.0%, a difference of 0.10%), and Immigrants from Belgium (21.0%, a difference of 0.12%).
| Demographics | Rating | Rank | Disability Age 65 to 74 |
| Okinawans | 100.0 /100 | #20 | Exceptional 20.7% |
| Immigrants | Bolivia | 99.9 /100 | #21 | Exceptional 20.8% |
| Immigrants | Iran | 99.9 /100 | #22 | Exceptional 20.9% |
| Immigrants | Belgium | 99.9 /100 | #23 | Exceptional 21.0% |
| Soviet Union | 99.9 /100 | #24 | Exceptional 21.0% |
| Bolivians | 99.9 /100 | #25 | Exceptional 21.0% |
| Immigrants | Australia | 99.9 /100 | #26 | Exceptional 21.0% |
| Immigrants | Sweden | 99.9 /100 | #27 | Exceptional 21.0% |
| Immigrants | Czechoslovakia | 99.9 /100 | #28 | Exceptional 21.0% |
| Immigrants | Japan | 99.9 /100 | #29 | Exceptional 21.0% |
| Immigrants | Greece | 99.9 /100 | #30 | Exceptional 21.0% |
| Immigrants | Northern Europe | 99.9 /100 | #31 | Exceptional 21.0% |
| Turks | 99.9 /100 | #32 | Exceptional 21.0% |
| Immigrants | Argentina | 99.9 /100 | #33 | Exceptional 21.1% |
| Immigrants | Sri Lanka | 99.9 /100 | #34 | Exceptional 21.1% |