Panamanian vs Kiowa Disability
COMPARE
Panamanian
Kiowa
Disability
Disability Comparison
Panamanians
Kiowa
12.1%
DISABILITY
5.4/ 100
METRIC RATING
216th/ 347
METRIC RANK
15.6%
DISABILITY
0.0/ 100
METRIC RATING
342nd/ 347
METRIC RANK
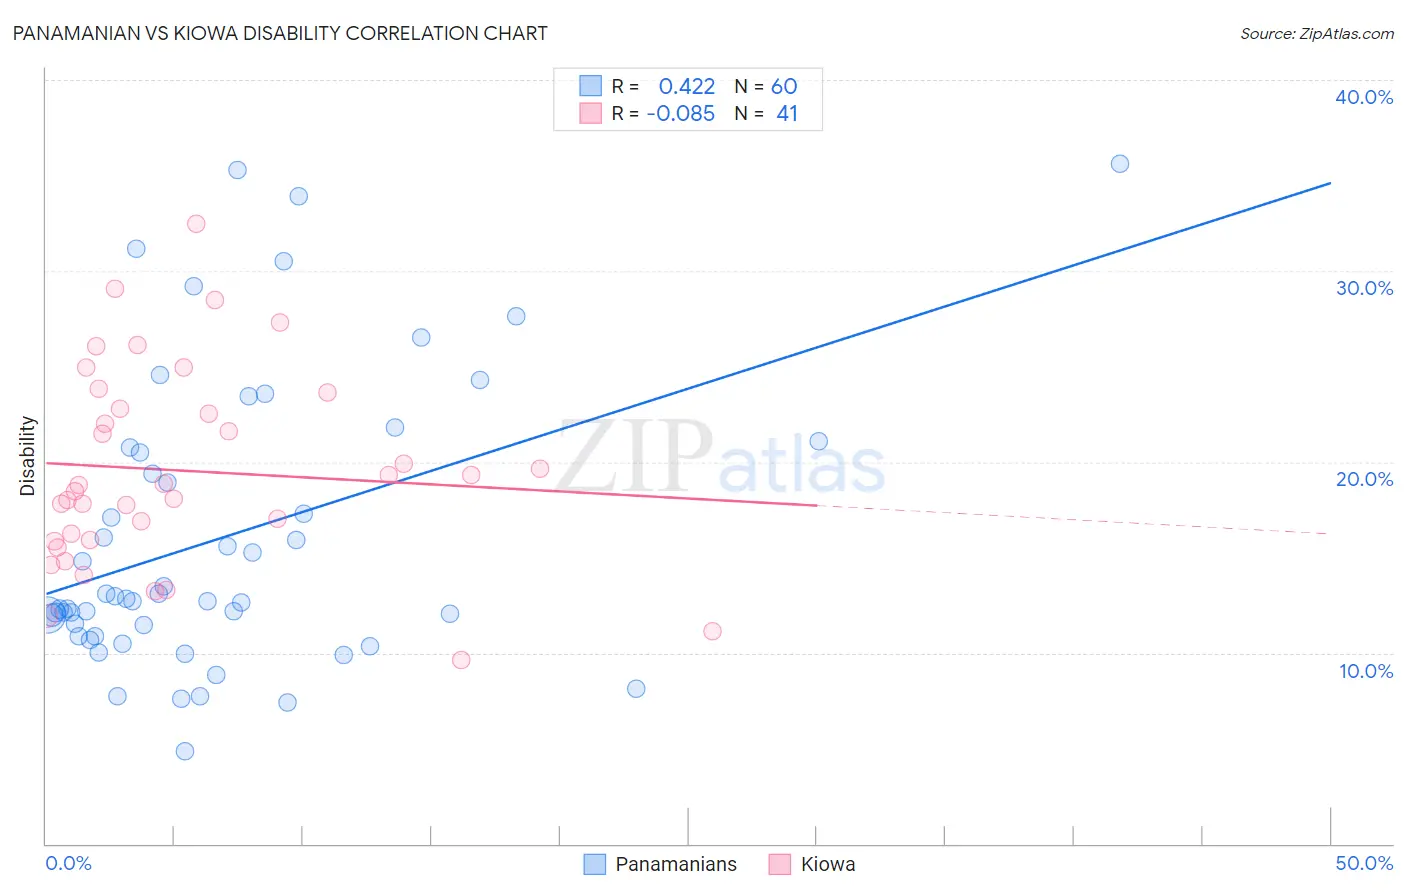
Panamanian vs Kiowa Disability Correlation Chart
The statistical analysis conducted on geographies consisting of 281,200,623 people shows a moderate positive correlation between the proportion of Panamanians and percentage of population with a disability in the United States with a correlation coefficient (R) of 0.422 and weighted average of 12.1%. Similarly, the statistical analysis conducted on geographies consisting of 56,099,396 people shows a slight negative correlation between the proportion of Kiowa and percentage of population with a disability in the United States with a correlation coefficient (R) of -0.085 and weighted average of 15.6%, a difference of 29.2%.
Disability Correlation Summary
| Measurement | Panamanian | Kiowa |
| Minimum | 4.8% | 9.6% |
| Maximum | 35.6% | 32.5% |
| Range | 30.8% | 22.9% |
| Mean | 16.1% | 19.5% |
| Median | 12.8% | 18.8% |
| Interquartile 25% (IQ1) | 11.2% | 15.9% |
| Interquartile 75% (IQ3) | 20.6% | 23.2% |
| Interquartile Range (IQR) | 9.5% | 7.3% |
| Standard Deviation (Sample) | 7.5% | 5.2% |
| Standard Deviation (Population) | 7.5% | 5.1% |
Similar Demographics by Disability
Demographics Similar to Panamanians by Disability
In terms of disability, the demographic groups most similar to Panamanians are Immigrants from North America (12.1%, a difference of 0.010%), Immigrants from Jamaica (12.1%, a difference of 0.070%), Croatian (12.1%, a difference of 0.11%), Immigrants from Canada (12.1%, a difference of 0.15%), and Immigrants from Bahamas (12.1%, a difference of 0.16%).
| Demographics | Rating | Rank | Disability |
| Danes | 8.7 /100 | #209 | Tragic 12.0% |
| Czechs | 7.9 /100 | #210 | Tragic 12.0% |
| Immigrants | Cambodia | 7.3 /100 | #211 | Tragic 12.0% |
| Austrians | 7.2 /100 | #212 | Tragic 12.0% |
| Immigrants | Iraq | 7.1 /100 | #213 | Tragic 12.0% |
| Immigrants | Somalia | 6.8 /100 | #214 | Tragic 12.0% |
| Immigrants | Canada | 6.1 /100 | #215 | Tragic 12.1% |
| Panamanians | 5.4 /100 | #216 | Tragic 12.1% |
| Immigrants | North America | 5.3 /100 | #217 | Tragic 12.1% |
| Immigrants | Jamaica | 5.0 /100 | #218 | Tragic 12.1% |
| Croatians | 4.9 /100 | #219 | Tragic 12.1% |
| Immigrants | Bahamas | 4.7 /100 | #220 | Tragic 12.1% |
| Northern Europeans | 4.2 /100 | #221 | Tragic 12.1% |
| Spanish American Indians | 4.1 /100 | #222 | Tragic 12.1% |
| Hispanics or Latinos | 3.9 /100 | #223 | Tragic 12.1% |
Demographics Similar to Kiowa by Disability
In terms of disability, the demographic groups most similar to Kiowa are Creek (15.6%, a difference of 0.010%), Lumbee (15.5%, a difference of 0.45%), Colville (15.8%, a difference of 1.2%), Choctaw (15.4%, a difference of 1.3%), and Chickasaw (15.2%, a difference of 2.8%).
| Demographics | Rating | Rank | Disability |
| Cajuns | 0.0 /100 | #333 | Tragic 14.6% |
| Yuman | 0.0 /100 | #334 | Tragic 14.6% |
| Tohono O'odham | 0.0 /100 | #335 | Tragic 14.8% |
| Cherokee | 0.0 /100 | #336 | Tragic 14.8% |
| Seminole | 0.0 /100 | #337 | Tragic 14.9% |
| Dutch West Indians | 0.0 /100 | #338 | Tragic 14.9% |
| Chickasaw | 0.0 /100 | #339 | Tragic 15.2% |
| Choctaw | 0.0 /100 | #340 | Tragic 15.4% |
| Lumbee | 0.0 /100 | #341 | Tragic 15.5% |
| Kiowa | 0.0 /100 | #342 | Tragic 15.6% |
| Creek | 0.0 /100 | #343 | Tragic 15.6% |
| Colville | 0.0 /100 | #344 | Tragic 15.8% |
| Puerto Ricans | 0.0 /100 | #345 | Tragic 16.1% |
| Tsimshian | 0.0 /100 | #346 | Tragic 16.1% |
| Houma | 0.0 /100 | #347 | Tragic 17.1% |