Ottawa vs Immigrants from Jordan Self-Care Disability
COMPARE
Ottawa
Immigrants from Jordan
Self-Care Disability
Self-Care Disability Comparison
Ottawa
Immigrants from Jordan
2.7%
SELF-CARE DISABILITY
0.1/ 100
METRIC RATING
278th/ 347
METRIC RANK
2.4%
SELF-CARE DISABILITY
97.7/ 100
METRIC RATING
91st/ 347
METRIC RANK
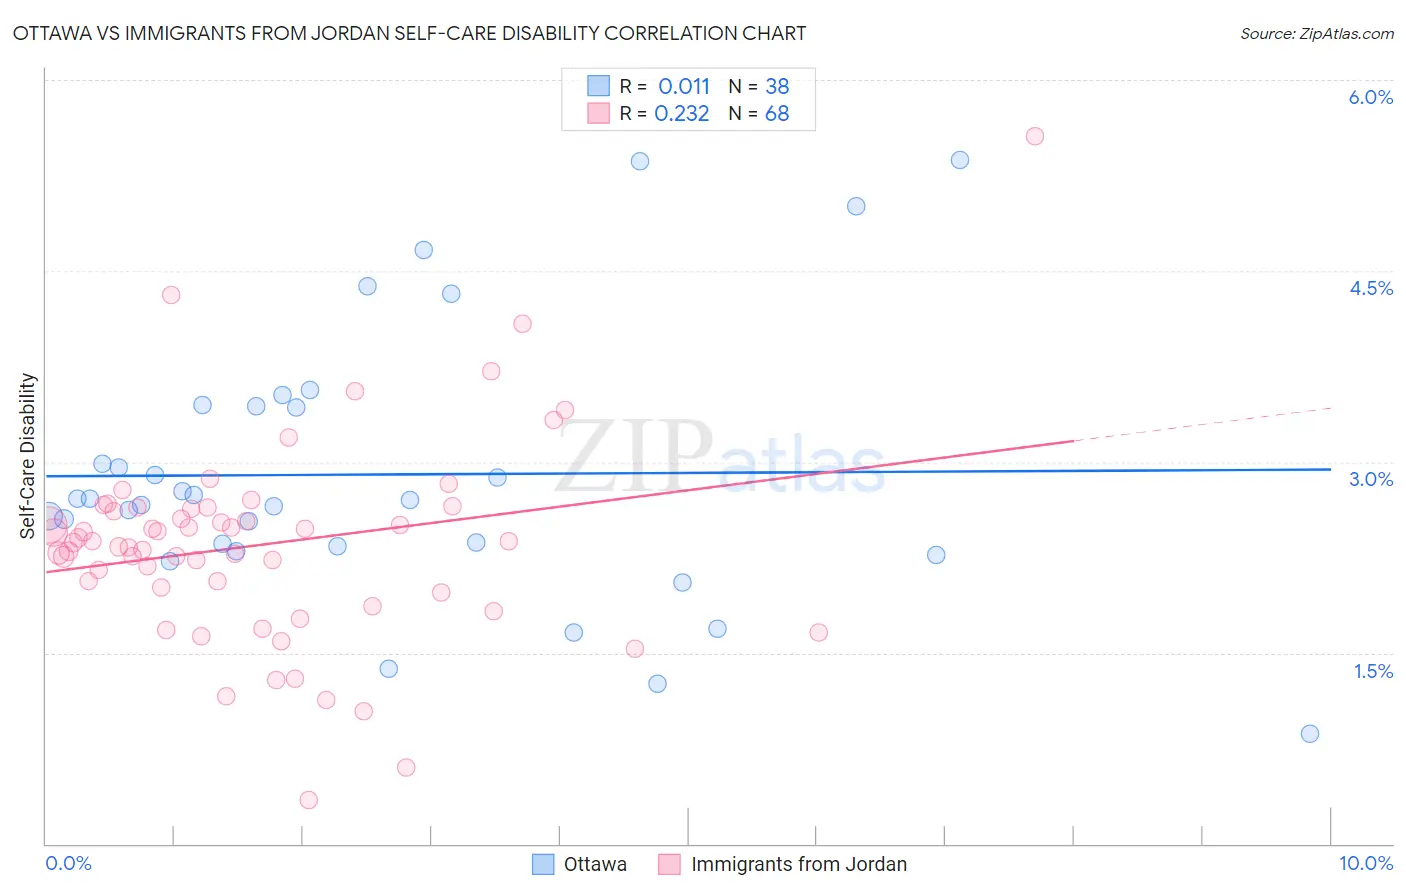
Ottawa vs Immigrants from Jordan Self-Care Disability Correlation Chart
The statistical analysis conducted on geographies consisting of 49,939,429 people shows no correlation between the proportion of Ottawa and percentage of population with self-care disability in the United States with a correlation coefficient (R) of 0.011 and weighted average of 2.7%. Similarly, the statistical analysis conducted on geographies consisting of 181,224,885 people shows a weak positive correlation between the proportion of Immigrants from Jordan and percentage of population with self-care disability in the United States with a correlation coefficient (R) of 0.232 and weighted average of 2.4%, a difference of 14.0%.
Self-Care Disability Correlation Summary
| Measurement | Ottawa | Immigrants from Jordan |
| Minimum | 0.86% | 0.35% |
| Maximum | 5.4% | 5.6% |
| Range | 4.5% | 5.2% |
| Mean | 2.9% | 2.4% |
| Median | 2.7% | 2.4% |
| Interquartile 25% (IQ1) | 2.3% | 2.0% |
| Interquartile 75% (IQ3) | 3.4% | 2.6% |
| Interquartile Range (IQR) | 1.1% | 0.64% |
| Standard Deviation (Sample) | 1.1% | 0.80% |
| Standard Deviation (Population) | 1.0% | 0.80% |
Similar Demographics by Self-Care Disability
Demographics Similar to Ottawa by Self-Care Disability
In terms of self-care disability, the demographic groups most similar to Ottawa are Immigrants from Ukraine (2.7%, a difference of 0.080%), Iroquois (2.7%, a difference of 0.10%), Hispanic or Latino (2.7%, a difference of 0.12%), Japanese (2.7%, a difference of 0.14%), and Yakama (2.7%, a difference of 0.27%).
| Demographics | Rating | Rank | Self-Care Disability |
| Trinidadians and Tobagonians | 0.1 /100 | #271 | Tragic 2.7% |
| Immigrants | Laos | 0.1 /100 | #272 | Tragic 2.7% |
| Mexicans | 0.1 /100 | #273 | Tragic 2.7% |
| Yakama | 0.1 /100 | #274 | Tragic 2.7% |
| Immigrants | Trinidad and Tobago | 0.1 /100 | #275 | Tragic 2.7% |
| Japanese | 0.1 /100 | #276 | Tragic 2.7% |
| Immigrants | Ukraine | 0.1 /100 | #277 | Tragic 2.7% |
| Ottawa | 0.1 /100 | #278 | Tragic 2.7% |
| Iroquois | 0.1 /100 | #279 | Tragic 2.7% |
| Hispanics or Latinos | 0.1 /100 | #280 | Tragic 2.7% |
| Immigrants | Iraq | 0.0 /100 | #281 | Tragic 2.7% |
| Apache | 0.0 /100 | #282 | Tragic 2.7% |
| Delaware | 0.0 /100 | #283 | Tragic 2.7% |
| Fijians | 0.0 /100 | #284 | Tragic 2.7% |
| Jamaicans | 0.0 /100 | #285 | Tragic 2.7% |
Demographics Similar to Immigrants from Jordan by Self-Care Disability
In terms of self-care disability, the demographic groups most similar to Immigrants from Jordan are Immigrants from Czechoslovakia (2.4%, a difference of 0.010%), Icelander (2.4%, a difference of 0.14%), Immigrants from Congo (2.4%, a difference of 0.15%), Sierra Leonean (2.4%, a difference of 0.20%), and Lithuanian (2.4%, a difference of 0.20%).
| Demographics | Rating | Rank | Self-Care Disability |
| Immigrants | Spain | 98.7 /100 | #84 | Exceptional 2.3% |
| Estonians | 98.3 /100 | #85 | Exceptional 2.3% |
| Immigrants | Northern Africa | 98.2 /100 | #86 | Exceptional 2.3% |
| Sierra Leoneans | 98.0 /100 | #87 | Exceptional 2.4% |
| Lithuanians | 98.0 /100 | #88 | Exceptional 2.4% |
| Immigrants | Congo | 98.0 /100 | #89 | Exceptional 2.4% |
| Immigrants | Czechoslovakia | 97.7 /100 | #90 | Exceptional 2.4% |
| Immigrants | Jordan | 97.7 /100 | #91 | Exceptional 2.4% |
| Icelanders | 97.4 /100 | #92 | Exceptional 2.4% |
| Immigrants | Latvia | 97.0 /100 | #93 | Exceptional 2.4% |
| Macedonians | 96.9 /100 | #94 | Exceptional 2.4% |
| Immigrants | Asia | 96.9 /100 | #95 | Exceptional 2.4% |
| Immigrants | Chile | 96.7 /100 | #96 | Exceptional 2.4% |
| Swiss | 96.6 /100 | #97 | Exceptional 2.4% |
| Immigrants | Poland | 96.4 /100 | #98 | Exceptional 2.4% |