Ottawa vs Albanian Self-Care Disability
COMPARE
Ottawa
Albanian
Self-Care Disability
Self-Care Disability Comparison
Ottawa
Albanians
2.7%
SELF-CARE DISABILITY
0.1/ 100
METRIC RATING
278th/ 347
METRIC RANK
2.6%
SELF-CARE DISABILITY
2.2/ 100
METRIC RATING
232nd/ 347
METRIC RANK
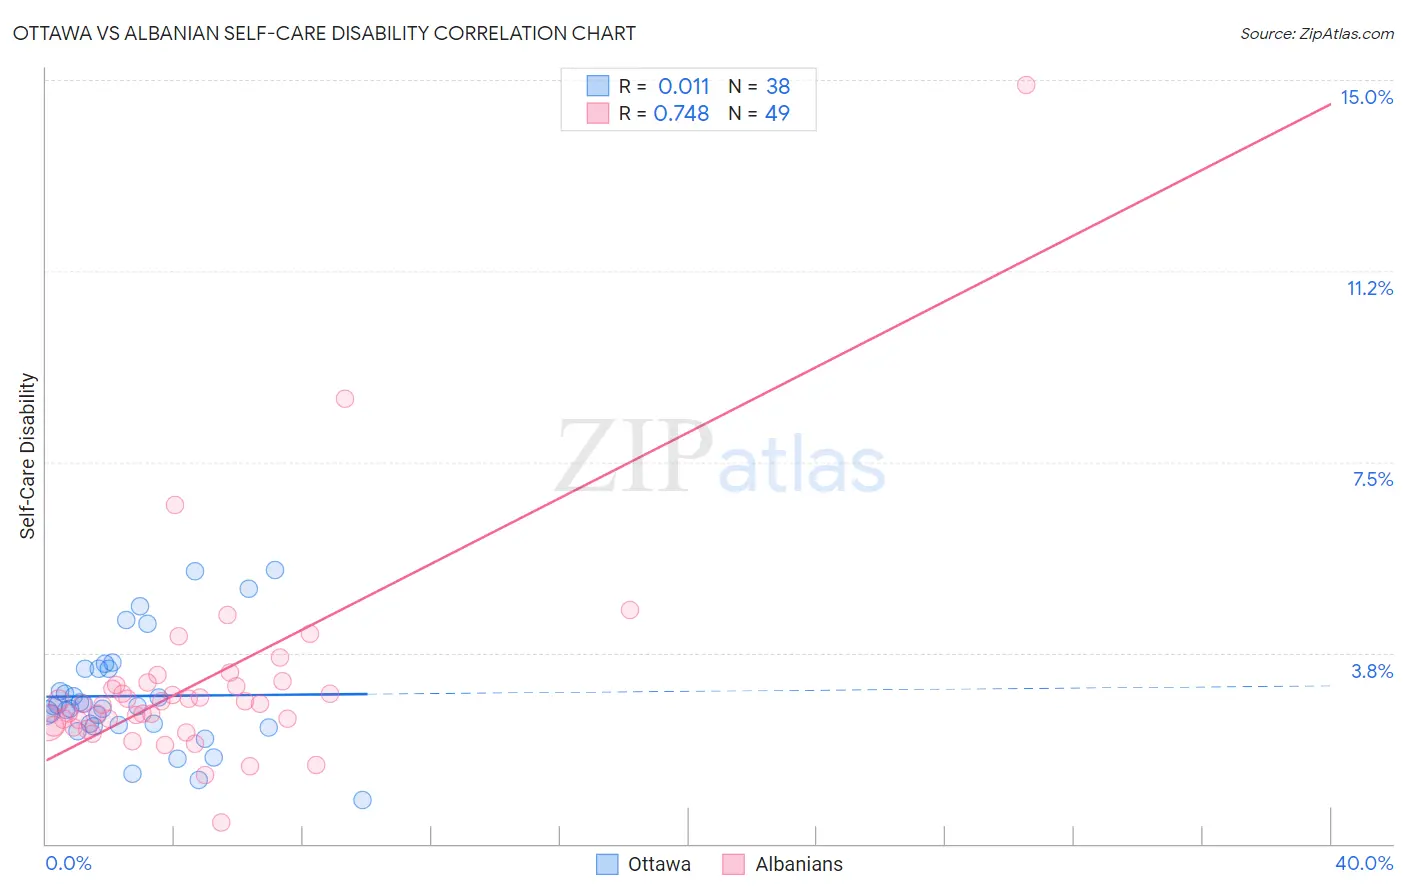
Ottawa vs Albanian Self-Care Disability Correlation Chart
The statistical analysis conducted on geographies consisting of 49,939,429 people shows no correlation between the proportion of Ottawa and percentage of population with self-care disability in the United States with a correlation coefficient (R) of 0.011 and weighted average of 2.7%. Similarly, the statistical analysis conducted on geographies consisting of 193,148,254 people shows a strong positive correlation between the proportion of Albanians and percentage of population with self-care disability in the United States with a correlation coefficient (R) of 0.748 and weighted average of 2.6%, a difference of 4.2%.
Self-Care Disability Correlation Summary
| Measurement | Ottawa | Albanian |
| Minimum | 0.86% | 0.42% |
| Maximum | 5.4% | 14.9% |
| Range | 4.5% | 14.5% |
| Mean | 2.9% | 3.2% |
| Median | 2.7% | 2.7% |
| Interquartile 25% (IQ1) | 2.3% | 2.3% |
| Interquartile 75% (IQ3) | 3.4% | 3.1% |
| Interquartile Range (IQR) | 1.1% | 0.80% |
| Standard Deviation (Sample) | 1.1% | 2.1% |
| Standard Deviation (Population) | 1.0% | 2.1% |
Similar Demographics by Self-Care Disability
Demographics Similar to Ottawa by Self-Care Disability
In terms of self-care disability, the demographic groups most similar to Ottawa are Immigrants from Ukraine (2.7%, a difference of 0.080%), Iroquois (2.7%, a difference of 0.10%), Hispanic or Latino (2.7%, a difference of 0.12%), Japanese (2.7%, a difference of 0.14%), and Yakama (2.7%, a difference of 0.27%).
| Demographics | Rating | Rank | Self-Care Disability |
| Trinidadians and Tobagonians | 0.1 /100 | #271 | Tragic 2.7% |
| Immigrants | Laos | 0.1 /100 | #272 | Tragic 2.7% |
| Mexicans | 0.1 /100 | #273 | Tragic 2.7% |
| Yakama | 0.1 /100 | #274 | Tragic 2.7% |
| Immigrants | Trinidad and Tobago | 0.1 /100 | #275 | Tragic 2.7% |
| Japanese | 0.1 /100 | #276 | Tragic 2.7% |
| Immigrants | Ukraine | 0.1 /100 | #277 | Tragic 2.7% |
| Ottawa | 0.1 /100 | #278 | Tragic 2.7% |
| Iroquois | 0.1 /100 | #279 | Tragic 2.7% |
| Hispanics or Latinos | 0.1 /100 | #280 | Tragic 2.7% |
| Immigrants | Iraq | 0.0 /100 | #281 | Tragic 2.7% |
| Apache | 0.0 /100 | #282 | Tragic 2.7% |
| Delaware | 0.0 /100 | #283 | Tragic 2.7% |
| Fijians | 0.0 /100 | #284 | Tragic 2.7% |
| Jamaicans | 0.0 /100 | #285 | Tragic 2.7% |
Demographics Similar to Albanians by Self-Care Disability
In terms of self-care disability, the demographic groups most similar to Albanians are Immigrants from Guatemala (2.6%, a difference of 0.030%), Liberian (2.6%, a difference of 0.040%), Vietnamese (2.6%, a difference of 0.050%), Bahamian (2.6%, a difference of 0.090%), and Bermudan (2.6%, a difference of 0.15%).
| Demographics | Rating | Rank | Self-Care Disability |
| Iraqis | 3.2 /100 | #225 | Tragic 2.6% |
| Chinese | 2.9 /100 | #226 | Tragic 2.6% |
| Immigrants | Philippines | 2.7 /100 | #227 | Tragic 2.6% |
| Guatemalans | 2.7 /100 | #228 | Tragic 2.6% |
| Guamanians/Chamorros | 2.5 /100 | #229 | Tragic 2.6% |
| Immigrants | Ecuador | 2.5 /100 | #230 | Tragic 2.6% |
| Immigrants | Guatemala | 2.2 /100 | #231 | Tragic 2.6% |
| Albanians | 2.2 /100 | #232 | Tragic 2.6% |
| Liberians | 2.1 /100 | #233 | Tragic 2.6% |
| Vietnamese | 2.1 /100 | #234 | Tragic 2.6% |
| Bahamians | 2.0 /100 | #235 | Tragic 2.6% |
| Bermudans | 1.9 /100 | #236 | Tragic 2.6% |
| Immigrants | Senegal | 1.6 /100 | #237 | Tragic 2.6% |
| Senegalese | 1.3 /100 | #238 | Tragic 2.6% |
| Immigrants | Panama | 1.2 /100 | #239 | Tragic 2.6% |