Immigrants from Moldova vs Immigrants from Jordan Self-Care Disability
COMPARE
Immigrants from Moldova
Immigrants from Jordan
Self-Care Disability
Self-Care Disability Comparison
Immigrants from Moldova
Immigrants from Jordan
2.6%
SELF-CARE DISABILITY
4.0/ 100
METRIC RATING
219th/ 347
METRIC RANK
2.4%
SELF-CARE DISABILITY
97.7/ 100
METRIC RATING
91st/ 347
METRIC RANK
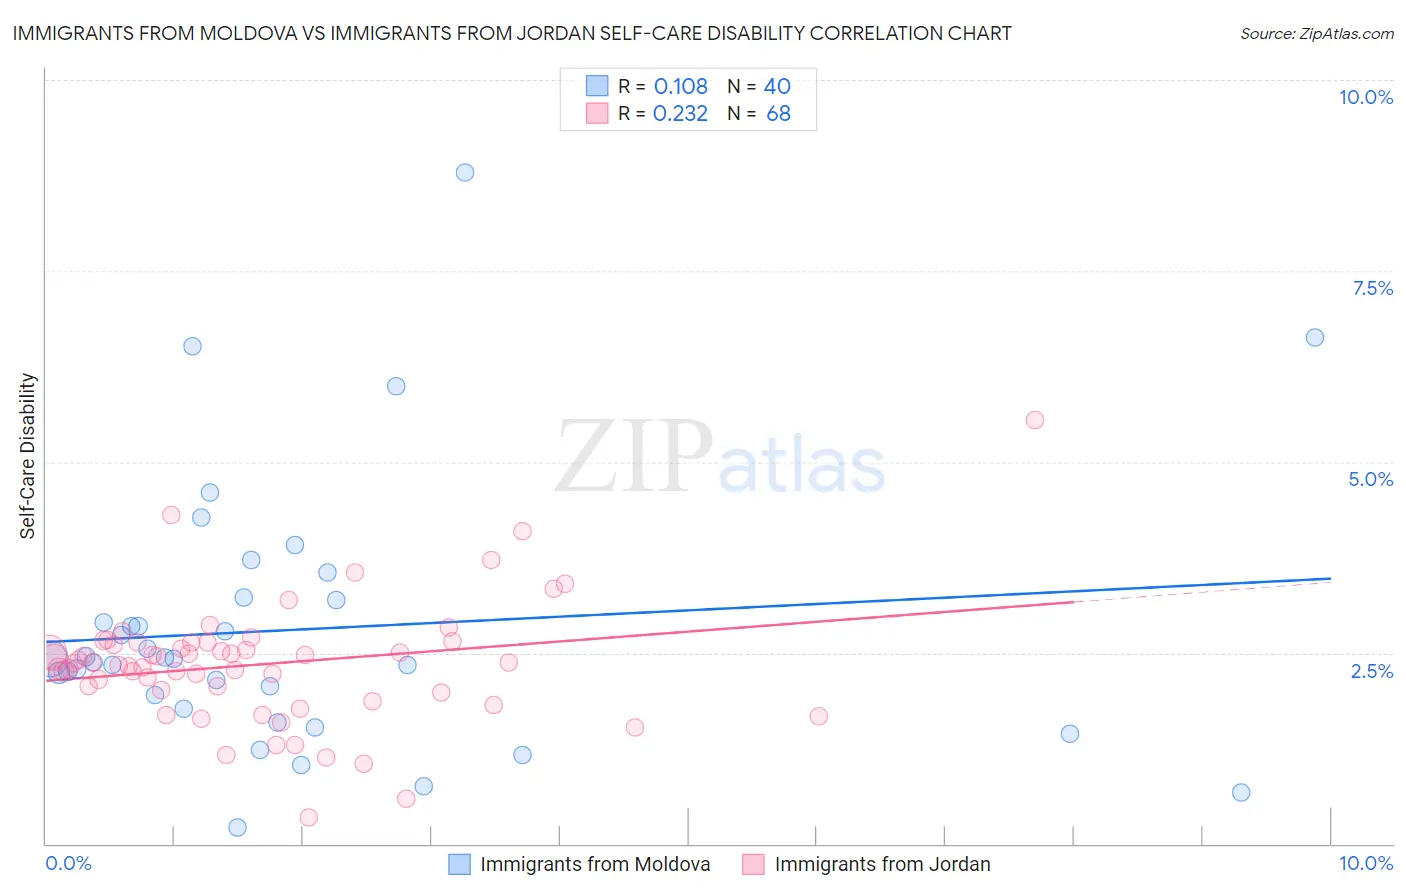
Immigrants from Moldova vs Immigrants from Jordan Self-Care Disability Correlation Chart
The statistical analysis conducted on geographies consisting of 124,345,596 people shows a poor positive correlation between the proportion of Immigrants from Moldova and percentage of population with self-care disability in the United States with a correlation coefficient (R) of 0.108 and weighted average of 2.6%. Similarly, the statistical analysis conducted on geographies consisting of 181,224,885 people shows a weak positive correlation between the proportion of Immigrants from Jordan and percentage of population with self-care disability in the United States with a correlation coefficient (R) of 0.232 and weighted average of 2.4%, a difference of 8.6%.
Self-Care Disability Correlation Summary
| Measurement | Immigrants from Moldova | Immigrants from Jordan |
| Minimum | 0.22% | 0.35% |
| Maximum | 8.8% | 5.6% |
| Range | 8.6% | 5.2% |
| Mean | 2.8% | 2.4% |
| Median | 2.4% | 2.4% |
| Interquartile 25% (IQ1) | 1.9% | 2.0% |
| Interquartile 75% (IQ3) | 3.2% | 2.6% |
| Interquartile Range (IQR) | 1.4% | 0.64% |
| Standard Deviation (Sample) | 1.7% | 0.80% |
| Standard Deviation (Population) | 1.7% | 0.80% |
Similar Demographics by Self-Care Disability
Demographics Similar to Immigrants from Moldova by Self-Care Disability
In terms of self-care disability, the demographic groups most similar to Immigrants from Moldova are Subsaharan African (2.6%, a difference of 0.010%), Scotch-Irish (2.6%, a difference of 0.030%), Honduran (2.6%, a difference of 0.050%), Spaniard (2.6%, a difference of 0.060%), and French Canadian (2.6%, a difference of 0.060%).
| Demographics | Rating | Rank | Self-Care Disability |
| Samoans | 5.1 /100 | #212 | Tragic 2.6% |
| Ecuadorians | 4.7 /100 | #213 | Tragic 2.6% |
| Immigrants | Honduras | 4.7 /100 | #214 | Tragic 2.6% |
| Immigrants | Thailand | 4.5 /100 | #215 | Tragic 2.6% |
| Whites/Caucasians | 4.4 /100 | #216 | Tragic 2.6% |
| Celtics | 4.4 /100 | #217 | Tragic 2.6% |
| Scotch-Irish | 4.1 /100 | #218 | Tragic 2.6% |
| Immigrants | Moldova | 4.0 /100 | #219 | Tragic 2.6% |
| Sub-Saharan Africans | 4.0 /100 | #220 | Tragic 2.6% |
| Hondurans | 3.8 /100 | #221 | Tragic 2.6% |
| Spaniards | 3.8 /100 | #222 | Tragic 2.6% |
| French Canadians | 3.8 /100 | #223 | Tragic 2.6% |
| Osage | 3.6 /100 | #224 | Tragic 2.6% |
| Iraqis | 3.2 /100 | #225 | Tragic 2.6% |
| Chinese | 2.9 /100 | #226 | Tragic 2.6% |
Demographics Similar to Immigrants from Jordan by Self-Care Disability
In terms of self-care disability, the demographic groups most similar to Immigrants from Jordan are Immigrants from Czechoslovakia (2.4%, a difference of 0.010%), Icelander (2.4%, a difference of 0.14%), Immigrants from Congo (2.4%, a difference of 0.15%), Sierra Leonean (2.4%, a difference of 0.20%), and Lithuanian (2.4%, a difference of 0.20%).
| Demographics | Rating | Rank | Self-Care Disability |
| Immigrants | Spain | 98.7 /100 | #84 | Exceptional 2.3% |
| Estonians | 98.3 /100 | #85 | Exceptional 2.3% |
| Immigrants | Northern Africa | 98.2 /100 | #86 | Exceptional 2.3% |
| Sierra Leoneans | 98.0 /100 | #87 | Exceptional 2.4% |
| Lithuanians | 98.0 /100 | #88 | Exceptional 2.4% |
| Immigrants | Congo | 98.0 /100 | #89 | Exceptional 2.4% |
| Immigrants | Czechoslovakia | 97.7 /100 | #90 | Exceptional 2.4% |
| Immigrants | Jordan | 97.7 /100 | #91 | Exceptional 2.4% |
| Icelanders | 97.4 /100 | #92 | Exceptional 2.4% |
| Immigrants | Latvia | 97.0 /100 | #93 | Exceptional 2.4% |
| Macedonians | 96.9 /100 | #94 | Exceptional 2.4% |
| Immigrants | Asia | 96.9 /100 | #95 | Exceptional 2.4% |
| Immigrants | Chile | 96.7 /100 | #96 | Exceptional 2.4% |
| Swiss | 96.6 /100 | #97 | Exceptional 2.4% |
| Immigrants | Poland | 96.4 /100 | #98 | Exceptional 2.4% |