Ottawa vs Immigrants from Hong Kong Female Disability
COMPARE
Ottawa
Immigrants from Hong Kong
Female Disability
Female Disability Comparison
Ottawa
Immigrants from Hong Kong
14.2%
FEMALE DISABILITY
0.0/ 100
METRIC RATING
327th/ 347
METRIC RANK
10.6%
FEMALE DISABILITY
100.0/ 100
METRIC RATING
10th/ 347
METRIC RANK
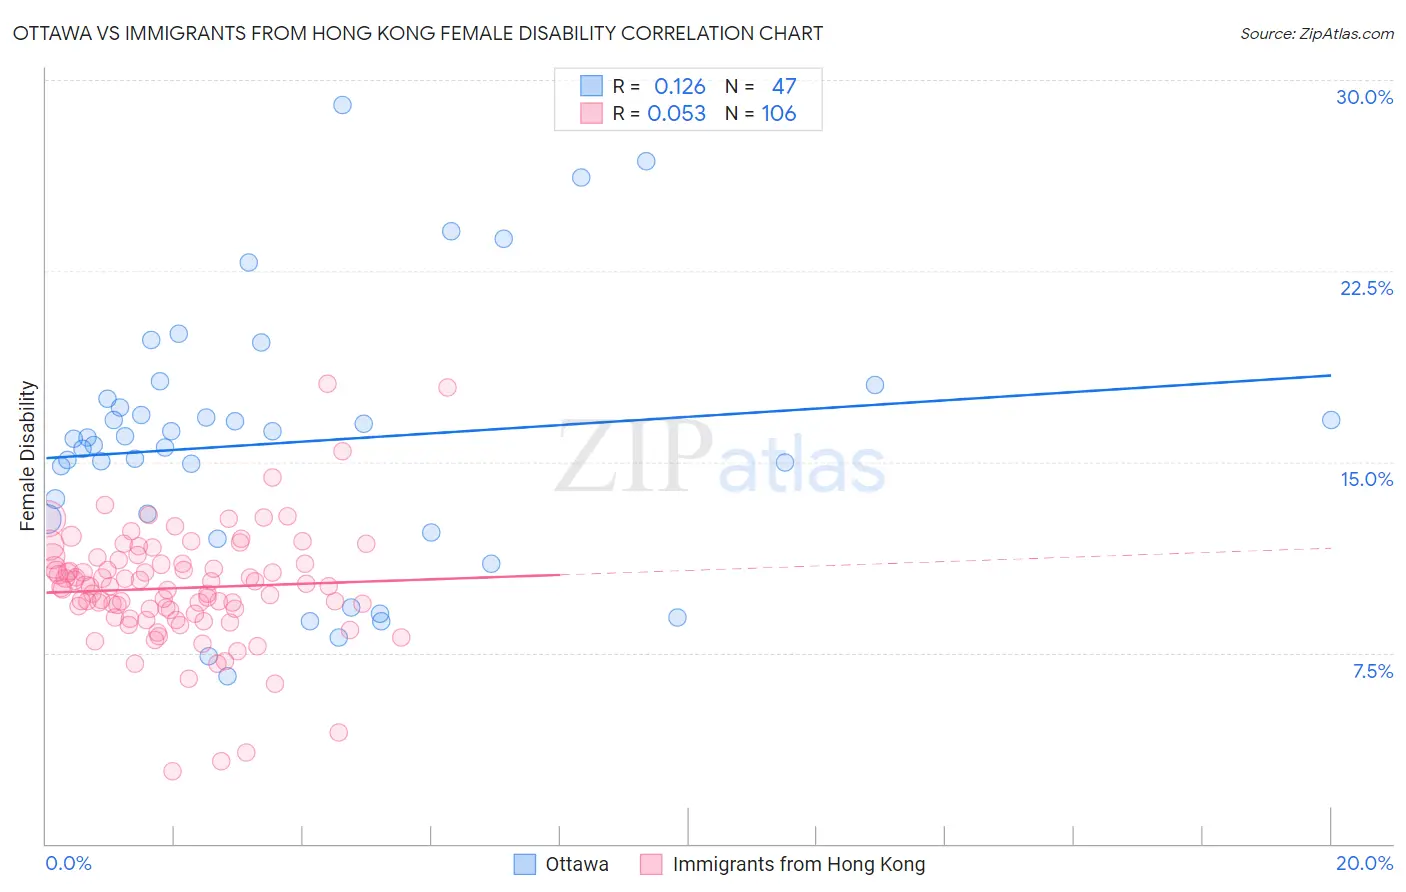
Ottawa vs Immigrants from Hong Kong Female Disability Correlation Chart
The statistical analysis conducted on geographies consisting of 49,954,639 people shows a poor positive correlation between the proportion of Ottawa and percentage of females with a disability in the United States with a correlation coefficient (R) of 0.126 and weighted average of 14.2%. Similarly, the statistical analysis conducted on geographies consisting of 253,994,726 people shows a slight positive correlation between the proportion of Immigrants from Hong Kong and percentage of females with a disability in the United States with a correlation coefficient (R) of 0.053 and weighted average of 10.6%, a difference of 34.1%.
Female Disability Correlation Summary
| Measurement | Ottawa | Immigrants from Hong Kong |
| Minimum | 6.6% | 2.9% |
| Maximum | 29.0% | 18.1% |
| Range | 22.4% | 15.2% |
| Mean | 15.8% | 10.0% |
| Median | 15.9% | 10.1% |
| Interquartile 25% (IQ1) | 12.8% | 9.0% |
| Interquartile 75% (IQ3) | 17.5% | 11.0% |
| Interquartile Range (IQR) | 4.7% | 2.0% |
| Standard Deviation (Sample) | 5.1% | 2.3% |
| Standard Deviation (Population) | 5.0% | 2.3% |
Similar Demographics by Female Disability
Demographics Similar to Ottawa by Female Disability
In terms of female disability, the demographic groups most similar to Ottawa are Cape Verdean (14.2%, a difference of 0.0%), Osage (14.3%, a difference of 0.43%), Comanche (14.2%, a difference of 0.44%), Navajo (14.2%, a difference of 0.55%), and Native/Alaskan (14.1%, a difference of 0.69%).
| Demographics | Rating | Rank | Female Disability |
| Americans | 0.0 /100 | #320 | Tragic 14.1% |
| Potawatomi | 0.0 /100 | #321 | Tragic 14.1% |
| Pueblo | 0.0 /100 | #322 | Tragic 14.1% |
| Blacks/African Americans | 0.0 /100 | #323 | Tragic 14.1% |
| Natives/Alaskans | 0.0 /100 | #324 | Tragic 14.1% |
| Navajo | 0.0 /100 | #325 | Tragic 14.2% |
| Comanche | 0.0 /100 | #326 | Tragic 14.2% |
| Ottawa | 0.0 /100 | #327 | Tragic 14.2% |
| Cape Verdeans | 0.0 /100 | #328 | Tragic 14.2% |
| Osage | 0.0 /100 | #329 | Tragic 14.3% |
| Yuman | 0.0 /100 | #330 | Tragic 14.5% |
| Immigrants | Cabo Verde | 0.0 /100 | #331 | Tragic 14.6% |
| Pima | 0.0 /100 | #332 | Tragic 14.8% |
| Immigrants | Azores | 0.0 /100 | #333 | Tragic 14.9% |
| Cherokee | 0.0 /100 | #334 | Tragic 14.9% |
Demographics Similar to Immigrants from Hong Kong by Female Disability
In terms of female disability, the demographic groups most similar to Immigrants from Hong Kong are Immigrants from Korea (10.6%, a difference of 0.17%), Immigrants from Israel (10.7%, a difference of 0.59%), Iranian (10.6%, a difference of 0.65%), Immigrants from Eastern Asia (10.7%, a difference of 0.66%), and Immigrants from China (10.7%, a difference of 0.69%).
| Demographics | Rating | Rank | Female Disability |
| Immigrants | Taiwan | 100.0 /100 | #3 | Exceptional 10.1% |
| Thais | 100.0 /100 | #4 | Exceptional 10.2% |
| Immigrants | Bolivia | 100.0 /100 | #5 | Exceptional 10.3% |
| Bolivians | 100.0 /100 | #6 | Exceptional 10.4% |
| Immigrants | Singapore | 100.0 /100 | #7 | Exceptional 10.4% |
| Immigrants | South Central Asia | 100.0 /100 | #8 | Exceptional 10.5% |
| Iranians | 100.0 /100 | #9 | Exceptional 10.6% |
| Immigrants | Hong Kong | 100.0 /100 | #10 | Exceptional 10.6% |
| Immigrants | Korea | 100.0 /100 | #11 | Exceptional 10.6% |
| Immigrants | Israel | 100.0 /100 | #12 | Exceptional 10.7% |
| Immigrants | Eastern Asia | 100.0 /100 | #13 | Exceptional 10.7% |
| Immigrants | China | 100.0 /100 | #14 | Exceptional 10.7% |
| Burmese | 100.0 /100 | #15 | Exceptional 10.7% |
| Okinawans | 100.0 /100 | #16 | Exceptional 10.8% |
| Indians (Asian) | 100.0 /100 | #17 | Exceptional 10.8% |