Ottawa vs Immigrants from Uganda Female Disability
COMPARE
Ottawa
Immigrants from Uganda
Female Disability
Female Disability Comparison
Ottawa
Immigrants from Uganda
14.2%
FEMALE DISABILITY
0.0/ 100
METRIC RATING
327th/ 347
METRIC RANK
11.8%
FEMALE DISABILITY
97.2/ 100
METRIC RATING
119th/ 347
METRIC RANK
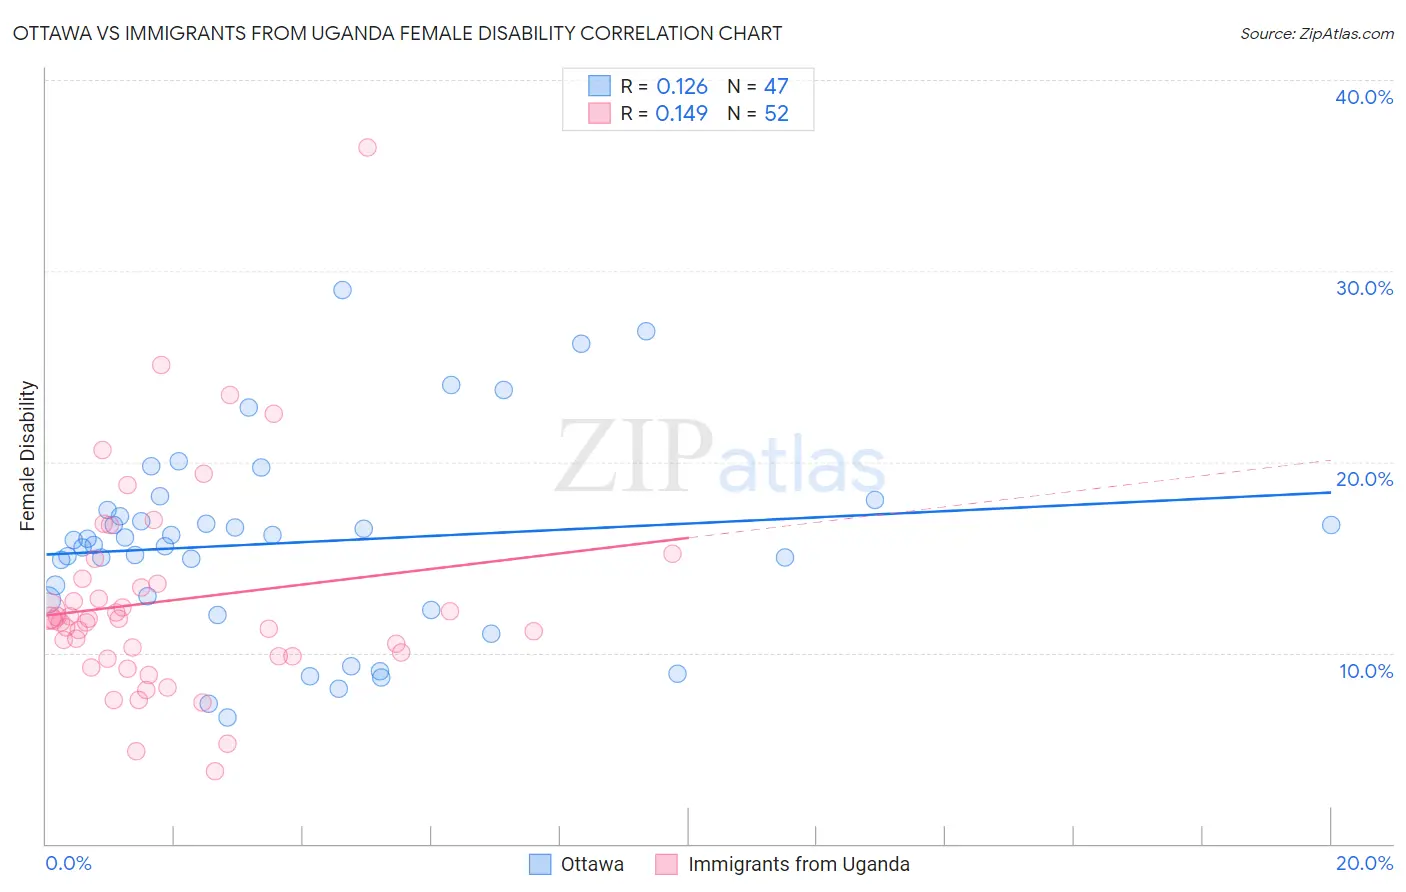
Ottawa vs Immigrants from Uganda Female Disability Correlation Chart
The statistical analysis conducted on geographies consisting of 49,954,639 people shows a poor positive correlation between the proportion of Ottawa and percentage of females with a disability in the United States with a correlation coefficient (R) of 0.126 and weighted average of 14.2%. Similarly, the statistical analysis conducted on geographies consisting of 125,980,314 people shows a poor positive correlation between the proportion of Immigrants from Uganda and percentage of females with a disability in the United States with a correlation coefficient (R) of 0.149 and weighted average of 11.8%, a difference of 20.8%.
Female Disability Correlation Summary
| Measurement | Ottawa | Immigrants from Uganda |
| Minimum | 6.6% | 3.8% |
| Maximum | 29.0% | 36.5% |
| Range | 22.4% | 32.6% |
| Mean | 15.8% | 12.7% |
| Median | 15.9% | 11.8% |
| Interquartile 25% (IQ1) | 12.8% | 9.8% |
| Interquartile 75% (IQ3) | 17.5% | 13.7% |
| Interquartile Range (IQR) | 4.7% | 3.9% |
| Standard Deviation (Sample) | 5.1% | 5.5% |
| Standard Deviation (Population) | 5.0% | 5.5% |
Similar Demographics by Female Disability
Demographics Similar to Ottawa by Female Disability
In terms of female disability, the demographic groups most similar to Ottawa are Cape Verdean (14.2%, a difference of 0.0%), Osage (14.3%, a difference of 0.43%), Comanche (14.2%, a difference of 0.44%), Navajo (14.2%, a difference of 0.55%), and Native/Alaskan (14.1%, a difference of 0.69%).
| Demographics | Rating | Rank | Female Disability |
| Americans | 0.0 /100 | #320 | Tragic 14.1% |
| Potawatomi | 0.0 /100 | #321 | Tragic 14.1% |
| Pueblo | 0.0 /100 | #322 | Tragic 14.1% |
| Blacks/African Americans | 0.0 /100 | #323 | Tragic 14.1% |
| Natives/Alaskans | 0.0 /100 | #324 | Tragic 14.1% |
| Navajo | 0.0 /100 | #325 | Tragic 14.2% |
| Comanche | 0.0 /100 | #326 | Tragic 14.2% |
| Ottawa | 0.0 /100 | #327 | Tragic 14.2% |
| Cape Verdeans | 0.0 /100 | #328 | Tragic 14.2% |
| Osage | 0.0 /100 | #329 | Tragic 14.3% |
| Yuman | 0.0 /100 | #330 | Tragic 14.5% |
| Immigrants | Cabo Verde | 0.0 /100 | #331 | Tragic 14.6% |
| Pima | 0.0 /100 | #332 | Tragic 14.8% |
| Immigrants | Azores | 0.0 /100 | #333 | Tragic 14.9% |
| Cherokee | 0.0 /100 | #334 | Tragic 14.9% |
Demographics Similar to Immigrants from Uganda by Female Disability
In terms of female disability, the demographic groups most similar to Immigrants from Uganda are Immigrants from Eastern Europe (11.8%, a difference of 0.010%), Immigrants from Nigeria (11.8%, a difference of 0.010%), Immigrants from Kazakhstan (11.8%, a difference of 0.080%), Immigrants from Netherlands (11.8%, a difference of 0.11%), and Immigrants from North Macedonia (11.8%, a difference of 0.12%).
| Demographics | Rating | Rank | Female Disability |
| Immigrants | Bangladesh | 97.8 /100 | #112 | Exceptional 11.8% |
| Immigrants | Belarus | 97.8 /100 | #113 | Exceptional 11.8% |
| South Africans | 97.7 /100 | #114 | Exceptional 11.8% |
| Brazilians | 97.7 /100 | #115 | Exceptional 11.8% |
| Immigrants | Morocco | 97.6 /100 | #116 | Exceptional 11.8% |
| Immigrants | Eastern Europe | 97.2 /100 | #117 | Exceptional 11.8% |
| Immigrants | Nigeria | 97.2 /100 | #118 | Exceptional 11.8% |
| Immigrants | Uganda | 97.2 /100 | #119 | Exceptional 11.8% |
| Immigrants | Kazakhstan | 97.0 /100 | #120 | Exceptional 11.8% |
| Immigrants | Netherlands | 96.9 /100 | #121 | Exceptional 11.8% |
| Immigrants | North Macedonia | 96.8 /100 | #122 | Exceptional 11.8% |
| Immigrants | Croatia | 96.7 /100 | #123 | Exceptional 11.8% |
| Russians | 96.5 /100 | #124 | Exceptional 11.8% |
| Immigrants | Italy | 96.4 /100 | #125 | Exceptional 11.8% |
| Immigrants | Europe | 96.2 /100 | #126 | Exceptional 11.8% |