Osage vs White/Caucasian Unemployment
COMPARE
Osage
White/Caucasian
Unemployment
Unemployment Comparison
Osage
Whites/Caucasians
5.0%
UNEMPLOYMENT
94.0/ 100
METRIC RATING
104th/ 347
METRIC RANK
4.9%
UNEMPLOYMENT
99.2/ 100
METRIC RATING
52nd/ 347
METRIC RANK
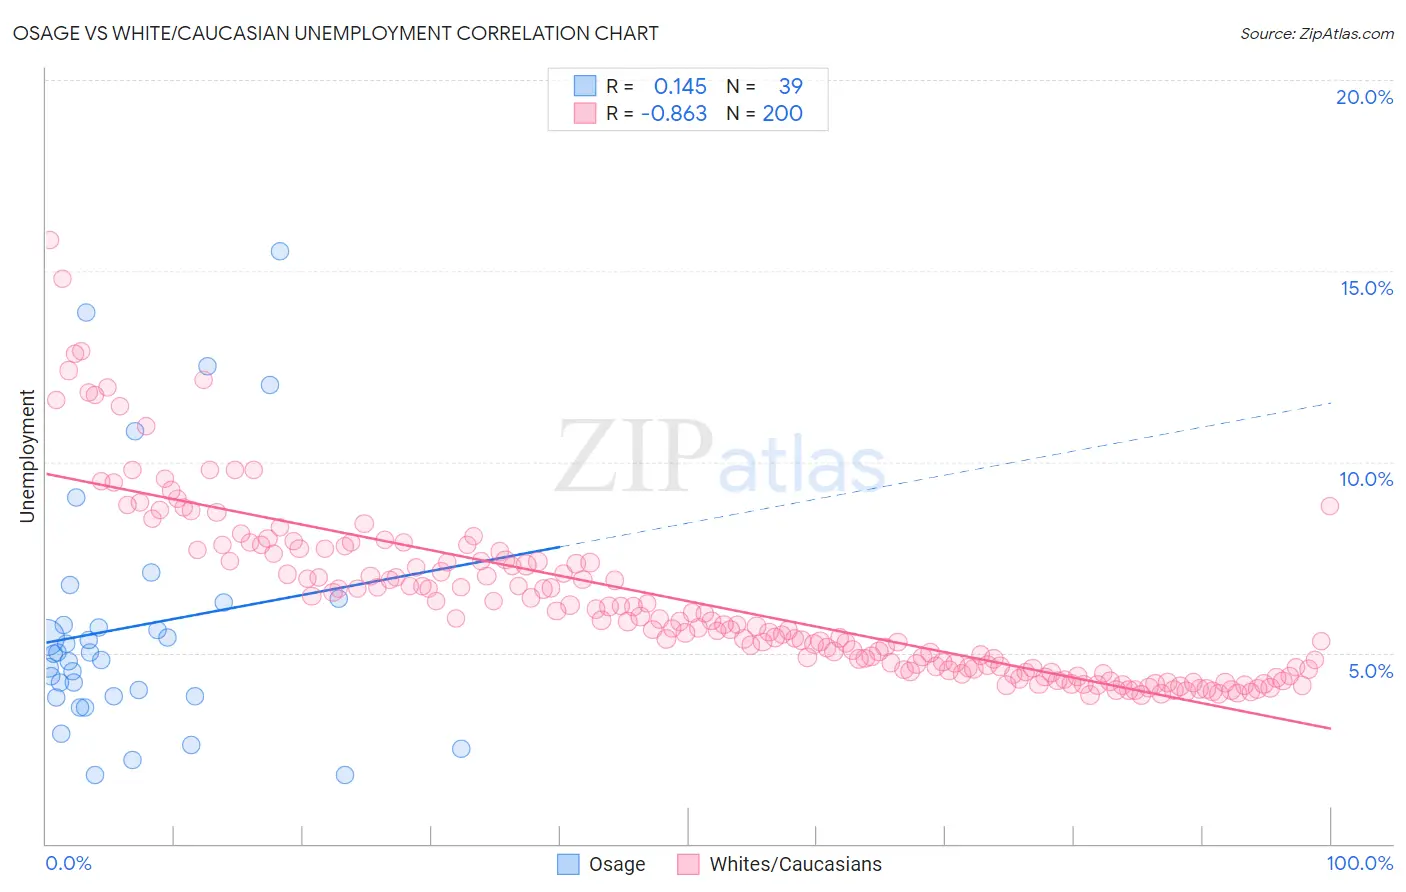
Osage vs White/Caucasian Unemployment Correlation Chart
The statistical analysis conducted on geographies consisting of 91,752,041 people shows a poor positive correlation between the proportion of Osage and unemployment in the United States with a correlation coefficient (R) of 0.145 and weighted average of 5.0%. Similarly, the statistical analysis conducted on geographies consisting of 578,869,025 people shows a very strong negative correlation between the proportion of Whites/Caucasians and unemployment in the United States with a correlation coefficient (R) of -0.863 and weighted average of 4.9%, a difference of 3.5%.
Unemployment Correlation Summary
| Measurement | Osage | White/Caucasian |
| Minimum | 1.8% | 3.9% |
| Maximum | 15.5% | 15.8% |
| Range | 13.7% | 11.9% |
| Mean | 5.7% | 6.3% |
| Median | 5.0% | 5.8% |
| Interquartile 25% (IQ1) | 3.9% | 4.6% |
| Interquartile 75% (IQ3) | 6.3% | 7.4% |
| Interquartile Range (IQR) | 2.5% | 2.8% |
| Standard Deviation (Sample) | 3.2% | 2.2% |
| Standard Deviation (Population) | 3.2% | 2.2% |
Similar Demographics by Unemployment
Demographics Similar to Osage by Unemployment
In terms of unemployment, the demographic groups most similar to Osage are Chickasaw (5.0%, a difference of 0.0%), Maltese (5.0%, a difference of 0.0%), Immigrants from Argentina (5.0%, a difference of 0.040%), Immigrants from Romania (5.0%, a difference of 0.070%), and American (5.0%, a difference of 0.080%).
| Demographics | Rating | Rank | Unemployment |
| Immigrants | Czechoslovakia | 95.1 /100 | #97 | Exceptional 5.0% |
| Romanians | 95.0 /100 | #98 | Exceptional 5.0% |
| Mongolians | 94.8 /100 | #99 | Exceptional 5.0% |
| Estonians | 94.6 /100 | #100 | Exceptional 5.0% |
| Americans | 94.3 /100 | #101 | Exceptional 5.0% |
| Immigrants | Argentina | 94.1 /100 | #102 | Exceptional 5.0% |
| Chickasaw | 94.0 /100 | #103 | Exceptional 5.0% |
| Osage | 94.0 /100 | #104 | Exceptional 5.0% |
| Maltese | 94.0 /100 | #105 | Exceptional 5.0% |
| Immigrants | Romania | 93.7 /100 | #106 | Exceptional 5.0% |
| Immigrants | Turkey | 93.7 /100 | #107 | Exceptional 5.0% |
| Immigrants | Kuwait | 93.7 /100 | #108 | Exceptional 5.0% |
| Immigrants | Eritrea | 93.3 /100 | #109 | Exceptional 5.0% |
| Immigrants | Lithuania | 93.2 /100 | #110 | Exceptional 5.0% |
| Chileans | 93.2 /100 | #111 | Exceptional 5.0% |
Demographics Similar to Whites/Caucasians by Unemployment
In terms of unemployment, the demographic groups most similar to Whites/Caucasians are Immigrants from Belgium (4.9%, a difference of 0.010%), Immigrants from Zimbabwe (4.9%, a difference of 0.030%), Eastern European (4.9%, a difference of 0.060%), Australian (4.9%, a difference of 0.090%), and French Canadian (4.9%, a difference of 0.17%).
| Demographics | Rating | Rank | Unemployment |
| French | 99.5 /100 | #45 | Exceptional 4.8% |
| Immigrants | Nepal | 99.4 /100 | #46 | Exceptional 4.8% |
| Immigrants | Taiwan | 99.4 /100 | #47 | Exceptional 4.8% |
| Immigrants | Scotland | 99.3 /100 | #48 | Exceptional 4.9% |
| Immigrants | South Central Asia | 99.3 /100 | #49 | Exceptional 4.9% |
| French Canadians | 99.3 /100 | #50 | Exceptional 4.9% |
| Immigrants | Belgium | 99.2 /100 | #51 | Exceptional 4.9% |
| Whites/Caucasians | 99.2 /100 | #52 | Exceptional 4.9% |
| Immigrants | Zimbabwe | 99.2 /100 | #53 | Exceptional 4.9% |
| Eastern Europeans | 99.2 /100 | #54 | Exceptional 4.9% |
| Australians | 99.2 /100 | #55 | Exceptional 4.9% |
| Celtics | 99.1 /100 | #56 | Exceptional 4.9% |
| Immigrants | Singapore | 99.1 /100 | #57 | Exceptional 4.9% |
| Greeks | 99.0 /100 | #58 | Exceptional 4.9% |
| Bhutanese | 99.0 /100 | #59 | Exceptional 4.9% |