Osage vs Indian (Asian) Disability
COMPARE
Osage
Indian (Asian)
Disability
Disability Comparison
Osage
Indians (Asian)
14.2%
DISABILITY
0.0/ 100
METRIC RATING
326th/ 347
METRIC RANK
10.3%
DISABILITY
100.0/ 100
METRIC RATING
16th/ 347
METRIC RANK
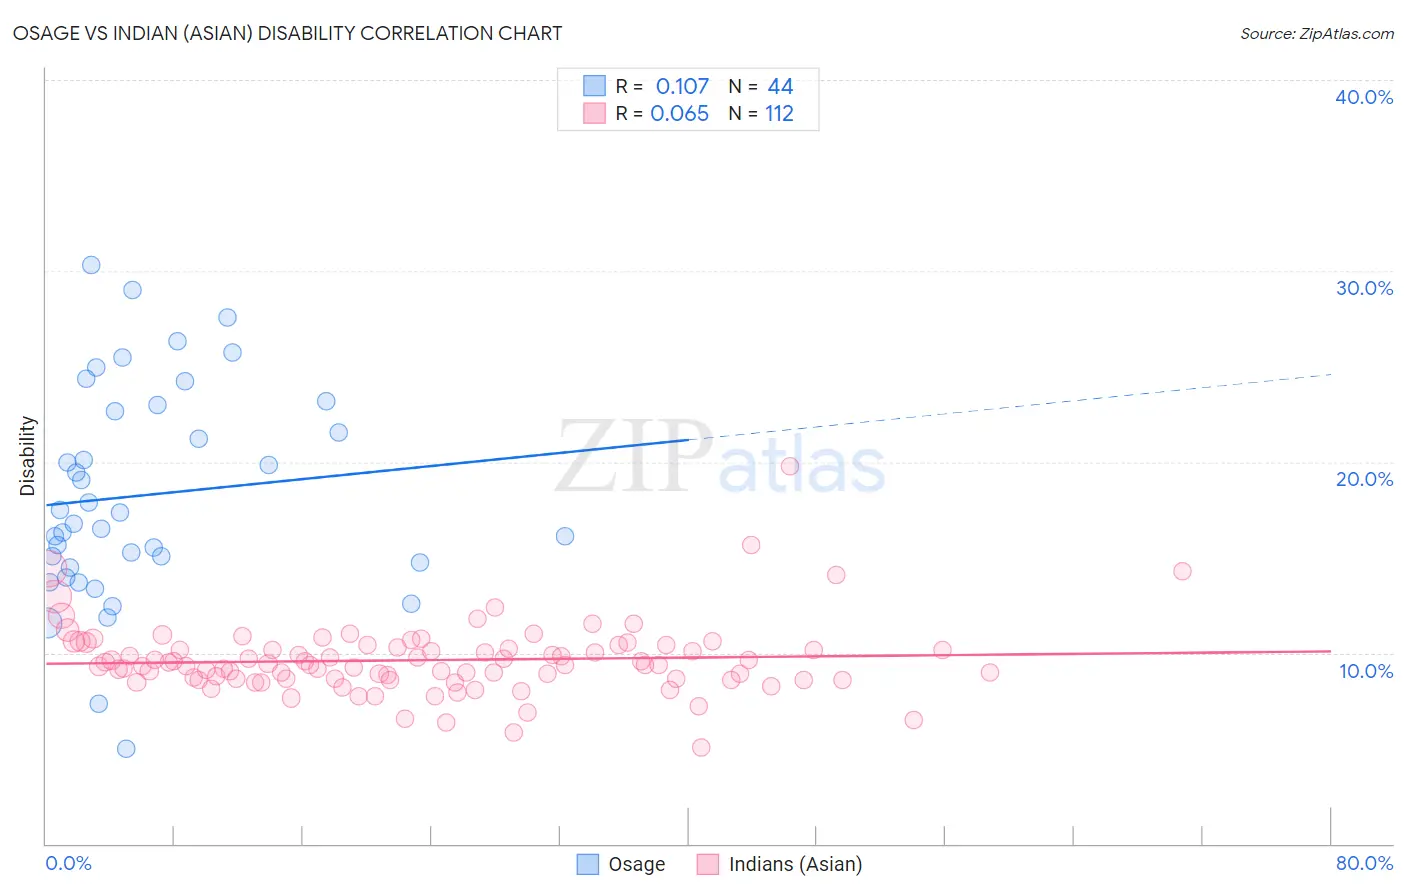
Osage vs Indian (Asian) Disability Correlation Chart
The statistical analysis conducted on geographies consisting of 91,799,709 people shows a poor positive correlation between the proportion of Osage and percentage of population with a disability in the United States with a correlation coefficient (R) of 0.107 and weighted average of 14.2%. Similarly, the statistical analysis conducted on geographies consisting of 495,278,900 people shows a slight positive correlation between the proportion of Indians (Asian) and percentage of population with a disability in the United States with a correlation coefficient (R) of 0.065 and weighted average of 10.3%, a difference of 38.0%.
Disability Correlation Summary
| Measurement | Osage | Indian (Asian) |
| Minimum | 5.0% | 5.0% |
| Maximum | 30.3% | 19.7% |
| Range | 25.3% | 14.7% |
| Mean | 18.3% | 9.6% |
| Median | 17.0% | 9.4% |
| Interquartile 25% (IQ1) | 14.6% | 8.6% |
| Interquartile 75% (IQ3) | 22.8% | 10.3% |
| Interquartile Range (IQR) | 8.2% | 1.7% |
| Standard Deviation (Sample) | 5.6% | 1.9% |
| Standard Deviation (Population) | 5.6% | 1.9% |
Similar Demographics by Disability
Demographics Similar to Osage by Disability
In terms of disability, the demographic groups most similar to Osage are Ottawa (14.2%, a difference of 0.020%), Immigrants from the Azores (14.2%, a difference of 0.020%), Native/Alaskan (14.2%, a difference of 0.030%), Chippewa (14.1%, a difference of 0.080%), and Potawatomi (14.2%, a difference of 0.14%).
| Demographics | Rating | Rank | Disability |
| Iroquois | 0.0 /100 | #319 | Tragic 13.8% |
| Apache | 0.0 /100 | #320 | Tragic 13.9% |
| Paiute | 0.0 /100 | #321 | Tragic 13.9% |
| Americans | 0.0 /100 | #322 | Tragic 13.9% |
| Comanche | 0.0 /100 | #323 | Tragic 14.1% |
| Chippewa | 0.0 /100 | #324 | Tragic 14.1% |
| Natives/Alaskans | 0.0 /100 | #325 | Tragic 14.2% |
| Osage | 0.0 /100 | #326 | Tragic 14.2% |
| Ottawa | 0.0 /100 | #327 | Tragic 14.2% |
| Immigrants | Azores | 0.0 /100 | #328 | Tragic 14.2% |
| Potawatomi | 0.0 /100 | #329 | Tragic 14.2% |
| Navajo | 0.0 /100 | #330 | Tragic 14.3% |
| Alaskan Athabascans | 0.0 /100 | #331 | Tragic 14.4% |
| Pueblo | 0.0 /100 | #332 | Tragic 14.4% |
| Cajuns | 0.0 /100 | #333 | Tragic 14.6% |
Demographics Similar to Indians (Asian) by Disability
In terms of disability, the demographic groups most similar to Indians (Asian) are Okinawan (10.3%, a difference of 0.070%), Immigrants from Iran (10.3%, a difference of 0.070%), Immigrants from Korea (10.2%, a difference of 0.37%), Immigrants from Eastern Asia (10.2%, a difference of 0.98%), and Burmese (10.4%, a difference of 1.1%).
| Demographics | Rating | Rank | Disability |
| Immigrants | Hong Kong | 100.0 /100 | #9 | Exceptional 10.0% |
| Immigrants | China | 100.0 /100 | #10 | Exceptional 10.1% |
| Iranians | 100.0 /100 | #11 | Exceptional 10.1% |
| Immigrants | Israel | 100.0 /100 | #12 | Exceptional 10.1% |
| Immigrants | Eastern Asia | 100.0 /100 | #13 | Exceptional 10.2% |
| Immigrants | Korea | 100.0 /100 | #14 | Exceptional 10.2% |
| Okinawans | 100.0 /100 | #15 | Exceptional 10.3% |
| Indians (Asian) | 100.0 /100 | #16 | Exceptional 10.3% |
| Immigrants | Iran | 100.0 /100 | #17 | Exceptional 10.3% |
| Burmese | 100.0 /100 | #18 | Exceptional 10.4% |
| Immigrants | Pakistan | 100.0 /100 | #19 | Exceptional 10.4% |
| Immigrants | Venezuela | 100.0 /100 | #20 | Exceptional 10.4% |
| Asians | 100.0 /100 | #21 | Exceptional 10.4% |
| Immigrants | Sri Lanka | 100.0 /100 | #22 | Exceptional 10.5% |
| Immigrants | Asia | 100.0 /100 | #23 | Exceptional 10.5% |