Osage vs Immigrants from Middle Africa Female Disability
COMPARE
Osage
Immigrants from Middle Africa
Female Disability
Female Disability Comparison
Osage
Immigrants from Middle Africa
14.3%
FEMALE DISABILITY
0.0/ 100
METRIC RATING
329th/ 347
METRIC RANK
12.1%
FEMALE DISABILITY
72.4/ 100
METRIC RATING
158th/ 347
METRIC RANK
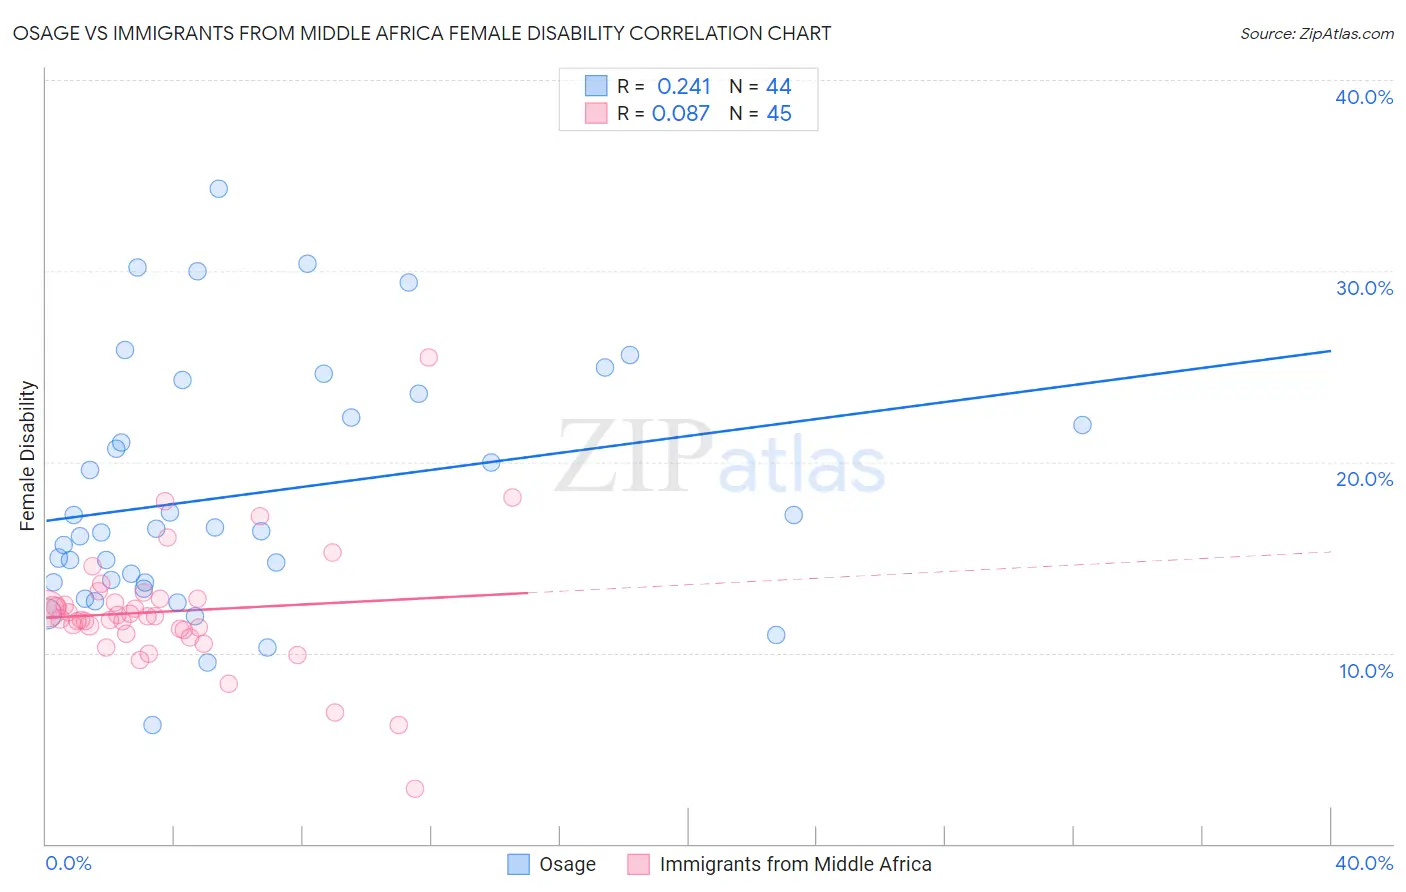
Osage vs Immigrants from Middle Africa Female Disability Correlation Chart
The statistical analysis conducted on geographies consisting of 91,799,541 people shows a weak positive correlation between the proportion of Osage and percentage of females with a disability in the United States with a correlation coefficient (R) of 0.241 and weighted average of 14.3%. Similarly, the statistical analysis conducted on geographies consisting of 202,716,278 people shows a slight positive correlation between the proportion of Immigrants from Middle Africa and percentage of females with a disability in the United States with a correlation coefficient (R) of 0.087 and weighted average of 12.1%, a difference of 18.3%.
Female Disability Correlation Summary
| Measurement | Osage | Immigrants from Middle Africa |
| Minimum | 6.2% | 2.9% |
| Maximum | 34.3% | 25.5% |
| Range | 28.1% | 22.6% |
| Mean | 18.3% | 12.2% |
| Median | 16.4% | 11.9% |
| Interquartile 25% (IQ1) | 13.7% | 11.1% |
| Interquartile 75% (IQ3) | 22.9% | 12.8% |
| Interquartile Range (IQR) | 9.2% | 1.7% |
| Standard Deviation (Sample) | 6.5% | 3.4% |
| Standard Deviation (Population) | 6.4% | 3.3% |
Similar Demographics by Female Disability
Demographics Similar to Osage by Female Disability
In terms of female disability, the demographic groups most similar to Osage are Ottawa (14.2%, a difference of 0.43%), Cape Verdean (14.2%, a difference of 0.43%), Comanche (14.2%, a difference of 0.87%), Navajo (14.2%, a difference of 0.98%), and Native/Alaskan (14.1%, a difference of 1.1%).
| Demographics | Rating | Rank | Female Disability |
| Pueblo | 0.0 /100 | #322 | Tragic 14.1% |
| Blacks/African Americans | 0.0 /100 | #323 | Tragic 14.1% |
| Natives/Alaskans | 0.0 /100 | #324 | Tragic 14.1% |
| Navajo | 0.0 /100 | #325 | Tragic 14.2% |
| Comanche | 0.0 /100 | #326 | Tragic 14.2% |
| Ottawa | 0.0 /100 | #327 | Tragic 14.2% |
| Cape Verdeans | 0.0 /100 | #328 | Tragic 14.2% |
| Osage | 0.0 /100 | #329 | Tragic 14.3% |
| Yuman | 0.0 /100 | #330 | Tragic 14.5% |
| Immigrants | Cabo Verde | 0.0 /100 | #331 | Tragic 14.6% |
| Pima | 0.0 /100 | #332 | Tragic 14.8% |
| Immigrants | Azores | 0.0 /100 | #333 | Tragic 14.9% |
| Cherokee | 0.0 /100 | #334 | Tragic 14.9% |
| Cajuns | 0.0 /100 | #335 | Tragic 14.9% |
| Seminole | 0.0 /100 | #336 | Tragic 15.0% |
Demographics Similar to Immigrants from Middle Africa by Female Disability
In terms of female disability, the demographic groups most similar to Immigrants from Middle Africa are Danish (12.1%, a difference of 0.010%), Moroccan (12.1%, a difference of 0.020%), Ghanaian (12.1%, a difference of 0.21%), Immigrants from Central America (12.1%, a difference of 0.21%), and Syrian (12.1%, a difference of 0.23%).
| Demographics | Rating | Rank | Female Disability |
| Icelanders | 80.7 /100 | #151 | Excellent 12.0% |
| Immigrants | Scotland | 79.3 /100 | #152 | Good 12.0% |
| Sudanese | 79.1 /100 | #153 | Good 12.0% |
| Syrians | 76.9 /100 | #154 | Good 12.1% |
| Ghanaians | 76.6 /100 | #155 | Good 12.1% |
| Moroccans | 72.9 /100 | #156 | Good 12.1% |
| Danes | 72.5 /100 | #157 | Good 12.1% |
| Immigrants | Middle Africa | 72.4 /100 | #158 | Good 12.1% |
| Immigrants | Central America | 67.7 /100 | #159 | Good 12.1% |
| Immigrants | Guatemala | 66.0 /100 | #160 | Good 12.1% |
| Guyanese | 64.7 /100 | #161 | Good 12.1% |
| Immigrants | Ukraine | 64.3 /100 | #162 | Good 12.1% |
| Guatemalans | 63.8 /100 | #163 | Good 12.1% |
| Czechs | 63.6 /100 | #164 | Good 12.1% |
| Immigrants | Oceania | 61.8 /100 | #165 | Good 12.1% |