Osage vs Immigrants from Laos Female Disability
COMPARE
Osage
Immigrants from Laos
Female Disability
Female Disability Comparison
Osage
Immigrants from Laos
14.3%
FEMALE DISABILITY
0.0/ 100
METRIC RATING
329th/ 347
METRIC RANK
12.8%
FEMALE DISABILITY
0.4/ 100
METRIC RATING
268th/ 347
METRIC RANK
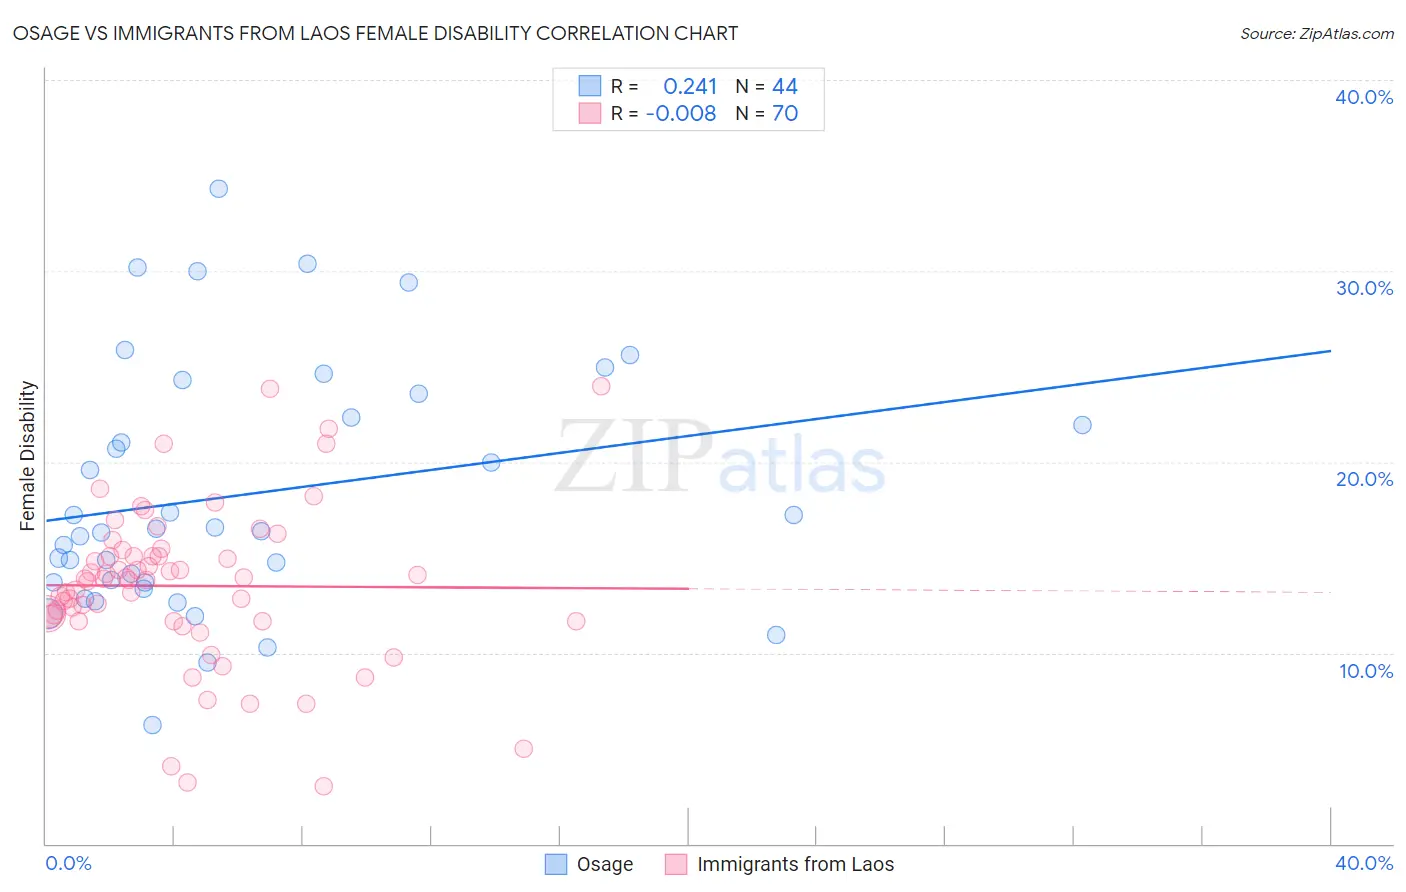
Osage vs Immigrants from Laos Female Disability Correlation Chart
The statistical analysis conducted on geographies consisting of 91,799,541 people shows a weak positive correlation between the proportion of Osage and percentage of females with a disability in the United States with a correlation coefficient (R) of 0.241 and weighted average of 14.3%. Similarly, the statistical analysis conducted on geographies consisting of 201,465,776 people shows no correlation between the proportion of Immigrants from Laos and percentage of females with a disability in the United States with a correlation coefficient (R) of -0.008 and weighted average of 12.8%, a difference of 11.5%.
Female Disability Correlation Summary
| Measurement | Osage | Immigrants from Laos |
| Minimum | 6.2% | 3.0% |
| Maximum | 34.3% | 24.0% |
| Range | 28.1% | 20.9% |
| Mean | 18.3% | 13.5% |
| Median | 16.4% | 13.9% |
| Interquartile 25% (IQ1) | 13.7% | 11.7% |
| Interquartile 75% (IQ3) | 22.9% | 15.1% |
| Interquartile Range (IQR) | 9.2% | 3.4% |
| Standard Deviation (Sample) | 6.5% | 4.1% |
| Standard Deviation (Population) | 6.4% | 4.1% |
Similar Demographics by Female Disability
Demographics Similar to Osage by Female Disability
In terms of female disability, the demographic groups most similar to Osage are Ottawa (14.2%, a difference of 0.43%), Cape Verdean (14.2%, a difference of 0.43%), Comanche (14.2%, a difference of 0.87%), Navajo (14.2%, a difference of 0.98%), and Native/Alaskan (14.1%, a difference of 1.1%).
| Demographics | Rating | Rank | Female Disability |
| Pueblo | 0.0 /100 | #322 | Tragic 14.1% |
| Blacks/African Americans | 0.0 /100 | #323 | Tragic 14.1% |
| Natives/Alaskans | 0.0 /100 | #324 | Tragic 14.1% |
| Navajo | 0.0 /100 | #325 | Tragic 14.2% |
| Comanche | 0.0 /100 | #326 | Tragic 14.2% |
| Ottawa | 0.0 /100 | #327 | Tragic 14.2% |
| Cape Verdeans | 0.0 /100 | #328 | Tragic 14.2% |
| Osage | 0.0 /100 | #329 | Tragic 14.3% |
| Yuman | 0.0 /100 | #330 | Tragic 14.5% |
| Immigrants | Cabo Verde | 0.0 /100 | #331 | Tragic 14.6% |
| Pima | 0.0 /100 | #332 | Tragic 14.8% |
| Immigrants | Azores | 0.0 /100 | #333 | Tragic 14.9% |
| Cherokee | 0.0 /100 | #334 | Tragic 14.9% |
| Cajuns | 0.0 /100 | #335 | Tragic 14.9% |
| Seminole | 0.0 /100 | #336 | Tragic 15.0% |
Demographics Similar to Immigrants from Laos by Female Disability
In terms of female disability, the demographic groups most similar to Immigrants from Laos are Senegalese (12.8%, a difference of 0.030%), Finnish (12.8%, a difference of 0.040%), Indonesian (12.8%, a difference of 0.060%), West Indian (12.8%, a difference of 0.16%), and Immigrants from Liberia (12.9%, a difference of 0.24%).
| Demographics | Rating | Rank | Female Disability |
| Bermudans | 1.0 /100 | #261 | Tragic 12.7% |
| Czechoslovakians | 0.9 /100 | #262 | Tragic 12.7% |
| Spaniards | 0.7 /100 | #263 | Tragic 12.8% |
| Alaska Natives | 0.6 /100 | #264 | Tragic 12.8% |
| West Indians | 0.5 /100 | #265 | Tragic 12.8% |
| Finns | 0.4 /100 | #266 | Tragic 12.8% |
| Senegalese | 0.4 /100 | #267 | Tragic 12.8% |
| Immigrants | Laos | 0.4 /100 | #268 | Tragic 12.8% |
| Indonesians | 0.4 /100 | #269 | Tragic 12.8% |
| Immigrants | Liberia | 0.3 /100 | #270 | Tragic 12.9% |
| Dutch | 0.2 /100 | #271 | Tragic 12.9% |
| Germans | 0.1 /100 | #272 | Tragic 12.9% |
| Sioux | 0.1 /100 | #273 | Tragic 12.9% |
| Portuguese | 0.1 /100 | #274 | Tragic 13.0% |
| Cheyenne | 0.1 /100 | #275 | Tragic 13.0% |