Belgian vs Immigrants from Middle Africa Female Disability
COMPARE
Belgian
Immigrants from Middle Africa
Female Disability
Female Disability Comparison
Belgians
Immigrants from Middle Africa
12.5%
FEMALE DISABILITY
6.5/ 100
METRIC RATING
231st/ 347
METRIC RANK
12.1%
FEMALE DISABILITY
72.4/ 100
METRIC RATING
158th/ 347
METRIC RANK
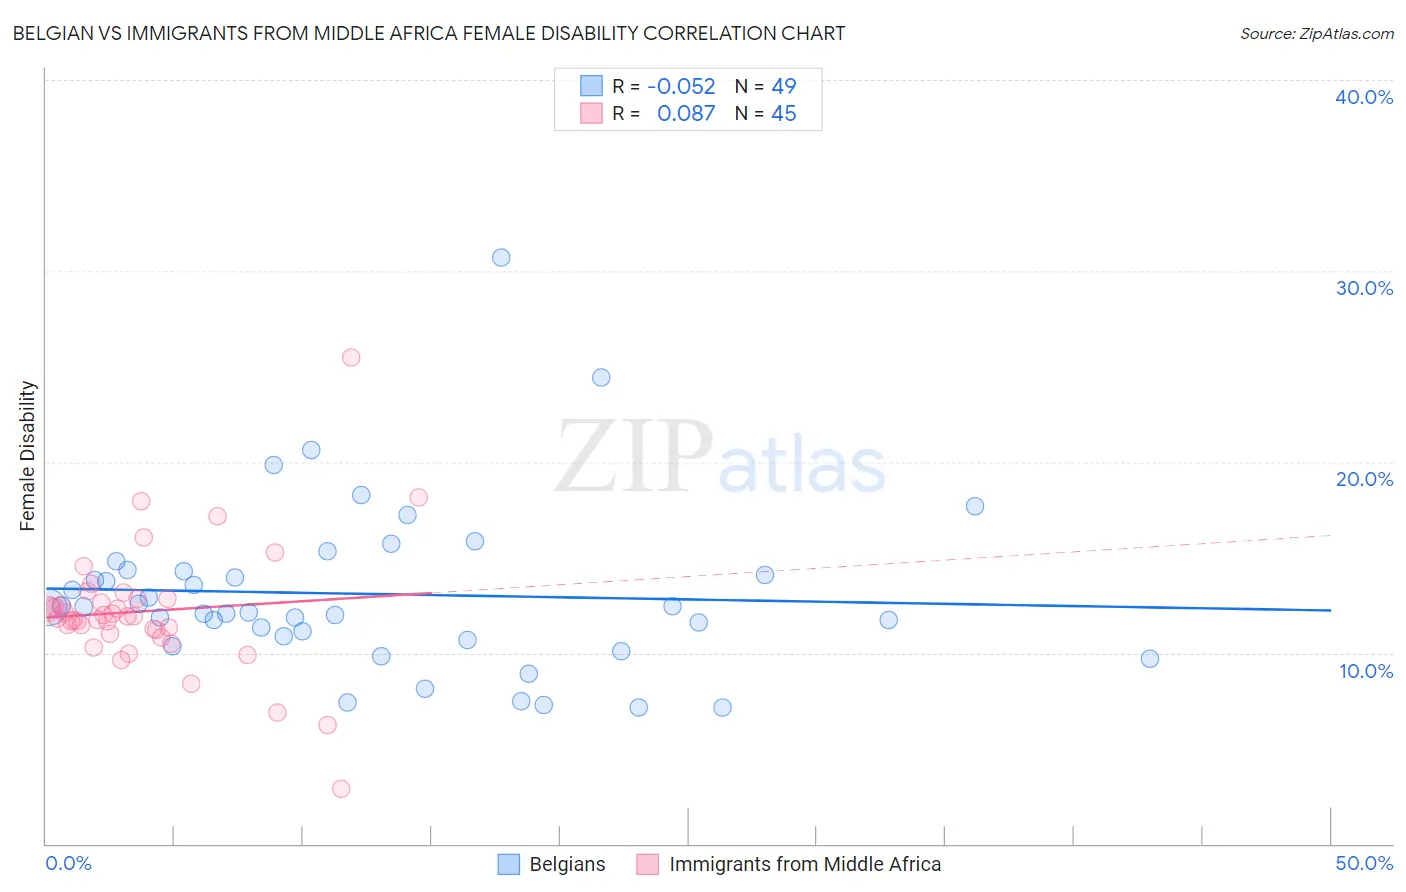
Belgian vs Immigrants from Middle Africa Female Disability Correlation Chart
The statistical analysis conducted on geographies consisting of 355,987,027 people shows a slight negative correlation between the proportion of Belgians and percentage of females with a disability in the United States with a correlation coefficient (R) of -0.052 and weighted average of 12.5%. Similarly, the statistical analysis conducted on geographies consisting of 202,716,278 people shows a slight positive correlation between the proportion of Immigrants from Middle Africa and percentage of females with a disability in the United States with a correlation coefficient (R) of 0.087 and weighted average of 12.1%, a difference of 3.5%.
Female Disability Correlation Summary
| Measurement | Belgian | Immigrants from Middle Africa |
| Minimum | 7.1% | 2.9% |
| Maximum | 30.7% | 25.5% |
| Range | 23.6% | 22.6% |
| Mean | 13.1% | 12.2% |
| Median | 12.3% | 11.9% |
| Interquartile 25% (IQ1) | 10.8% | 11.1% |
| Interquartile 75% (IQ3) | 14.3% | 12.8% |
| Interquartile Range (IQR) | 3.5% | 1.7% |
| Standard Deviation (Sample) | 4.4% | 3.4% |
| Standard Deviation (Population) | 4.3% | 3.3% |
Similar Demographics by Female Disability
Demographics Similar to Belgians by Female Disability
In terms of female disability, the demographic groups most similar to Belgians are Immigrants from Belize (12.5%, a difference of 0.070%), Immigrants from Somalia (12.5%, a difference of 0.090%), Hungarian (12.5%, a difference of 0.11%), Immigrants from Cambodia (12.5%, a difference of 0.18%), and Immigrants from Iraq (12.5%, a difference of 0.19%).
| Demographics | Rating | Rank | Female Disability |
| Belizeans | 9.3 /100 | #224 | Tragic 12.5% |
| Poles | 8.4 /100 | #225 | Tragic 12.5% |
| Hispanics or Latinos | 8.0 /100 | #226 | Tragic 12.5% |
| Assyrians/Chaldeans/Syriacs | 8.0 /100 | #227 | Tragic 12.5% |
| Immigrants | Cambodia | 7.8 /100 | #228 | Tragic 12.5% |
| Hungarians | 7.2 /100 | #229 | Tragic 12.5% |
| Immigrants | Belize | 7.0 /100 | #230 | Tragic 12.5% |
| Belgians | 6.5 /100 | #231 | Tragic 12.5% |
| Immigrants | Somalia | 5.9 /100 | #232 | Tragic 12.5% |
| Immigrants | Iraq | 5.3 /100 | #233 | Tragic 12.5% |
| Scandinavians | 5.3 /100 | #234 | Tragic 12.5% |
| Malaysians | 5.0 /100 | #235 | Tragic 12.5% |
| Immigrants | West Indies | 4.4 /100 | #236 | Tragic 12.6% |
| Slavs | 3.8 /100 | #237 | Tragic 12.6% |
| Yugoslavians | 3.7 /100 | #238 | Tragic 12.6% |
Demographics Similar to Immigrants from Middle Africa by Female Disability
In terms of female disability, the demographic groups most similar to Immigrants from Middle Africa are Danish (12.1%, a difference of 0.010%), Moroccan (12.1%, a difference of 0.020%), Ghanaian (12.1%, a difference of 0.21%), Immigrants from Central America (12.1%, a difference of 0.21%), and Syrian (12.1%, a difference of 0.23%).
| Demographics | Rating | Rank | Female Disability |
| Icelanders | 80.7 /100 | #151 | Excellent 12.0% |
| Immigrants | Scotland | 79.3 /100 | #152 | Good 12.0% |
| Sudanese | 79.1 /100 | #153 | Good 12.0% |
| Syrians | 76.9 /100 | #154 | Good 12.1% |
| Ghanaians | 76.6 /100 | #155 | Good 12.1% |
| Moroccans | 72.9 /100 | #156 | Good 12.1% |
| Danes | 72.5 /100 | #157 | Good 12.1% |
| Immigrants | Middle Africa | 72.4 /100 | #158 | Good 12.1% |
| Immigrants | Central America | 67.7 /100 | #159 | Good 12.1% |
| Immigrants | Guatemala | 66.0 /100 | #160 | Good 12.1% |
| Guyanese | 64.7 /100 | #161 | Good 12.1% |
| Immigrants | Ukraine | 64.3 /100 | #162 | Good 12.1% |
| Guatemalans | 63.8 /100 | #163 | Good 12.1% |
| Czechs | 63.6 /100 | #164 | Good 12.1% |
| Immigrants | Oceania | 61.8 /100 | #165 | Good 12.1% |