Osage vs Swiss Female Disability
COMPARE
Osage
Swiss
Female Disability
Female Disability Comparison
Osage
Swiss
14.3%
FEMALE DISABILITY
0.0/ 100
METRIC RATING
329th/ 347
METRIC RANK
12.4%
FEMALE DISABILITY
14.9/ 100
METRIC RATING
210th/ 347
METRIC RANK
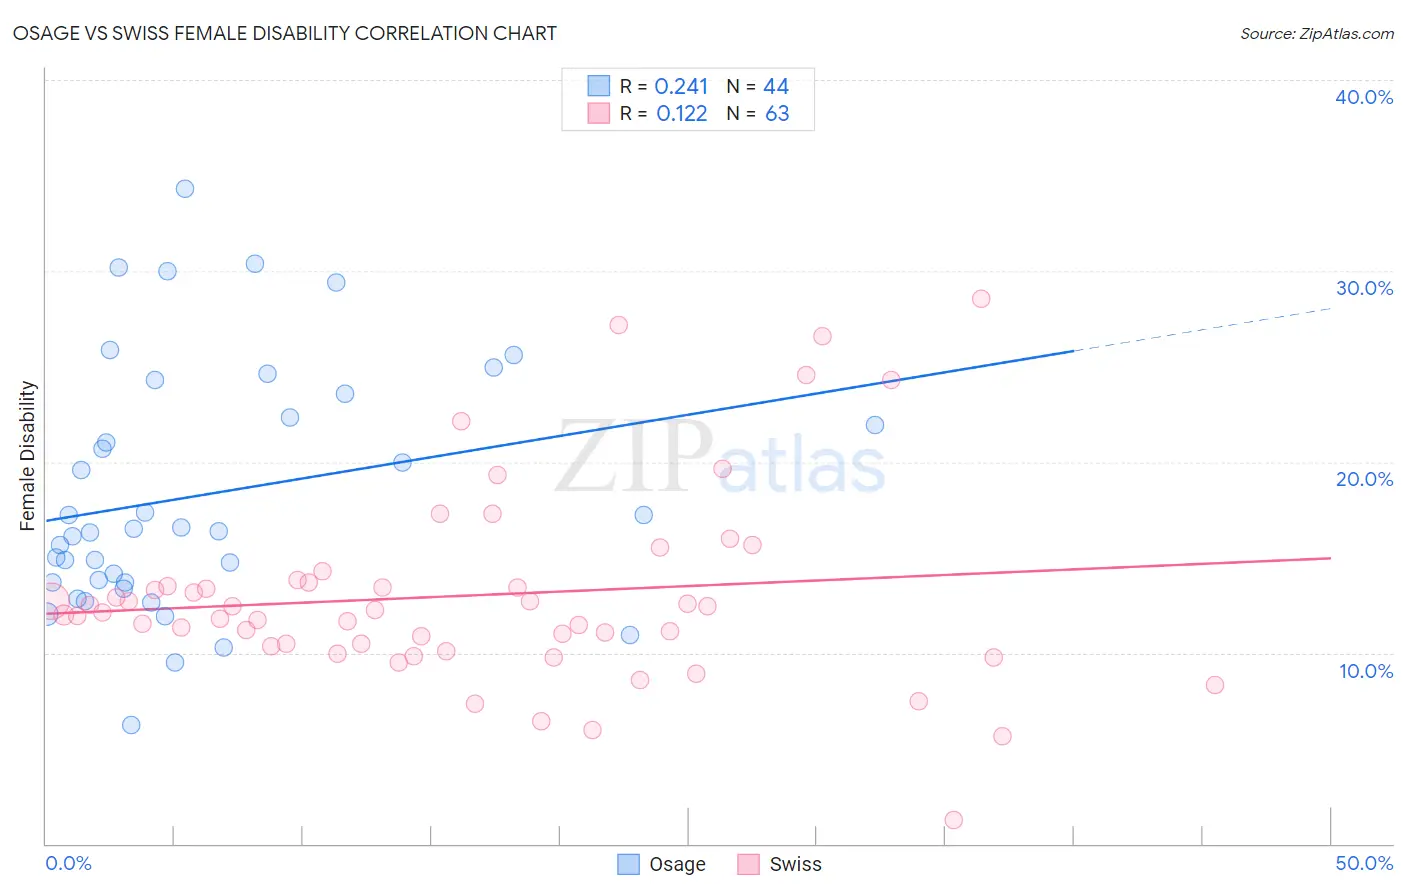
Osage vs Swiss Female Disability Correlation Chart
The statistical analysis conducted on geographies consisting of 91,799,541 people shows a weak positive correlation between the proportion of Osage and percentage of females with a disability in the United States with a correlation coefficient (R) of 0.241 and weighted average of 14.3%. Similarly, the statistical analysis conducted on geographies consisting of 464,961,657 people shows a poor positive correlation between the proportion of Swiss and percentage of females with a disability in the United States with a correlation coefficient (R) of 0.122 and weighted average of 12.4%, a difference of 15.4%.
Female Disability Correlation Summary
| Measurement | Osage | Swiss |
| Minimum | 6.2% | 1.3% |
| Maximum | 34.3% | 28.6% |
| Range | 28.1% | 27.3% |
| Mean | 18.3% | 13.0% |
| Median | 16.4% | 12.1% |
| Interquartile 25% (IQ1) | 13.7% | 10.4% |
| Interquartile 75% (IQ3) | 22.9% | 13.7% |
| Interquartile Range (IQR) | 9.2% | 3.3% |
| Standard Deviation (Sample) | 6.5% | 5.1% |
| Standard Deviation (Population) | 6.4% | 5.1% |
Similar Demographics by Female Disability
Demographics Similar to Osage by Female Disability
In terms of female disability, the demographic groups most similar to Osage are Ottawa (14.2%, a difference of 0.43%), Cape Verdean (14.2%, a difference of 0.43%), Comanche (14.2%, a difference of 0.87%), Navajo (14.2%, a difference of 0.98%), and Native/Alaskan (14.1%, a difference of 1.1%).
| Demographics | Rating | Rank | Female Disability |
| Pueblo | 0.0 /100 | #322 | Tragic 14.1% |
| Blacks/African Americans | 0.0 /100 | #323 | Tragic 14.1% |
| Natives/Alaskans | 0.0 /100 | #324 | Tragic 14.1% |
| Navajo | 0.0 /100 | #325 | Tragic 14.2% |
| Comanche | 0.0 /100 | #326 | Tragic 14.2% |
| Ottawa | 0.0 /100 | #327 | Tragic 14.2% |
| Cape Verdeans | 0.0 /100 | #328 | Tragic 14.2% |
| Osage | 0.0 /100 | #329 | Tragic 14.3% |
| Yuman | 0.0 /100 | #330 | Tragic 14.5% |
| Immigrants | Cabo Verde | 0.0 /100 | #331 | Tragic 14.6% |
| Pima | 0.0 /100 | #332 | Tragic 14.8% |
| Immigrants | Azores | 0.0 /100 | #333 | Tragic 14.9% |
| Cherokee | 0.0 /100 | #334 | Tragic 14.9% |
| Cajuns | 0.0 /100 | #335 | Tragic 14.9% |
| Seminole | 0.0 /100 | #336 | Tragic 15.0% |
Demographics Similar to Swiss by Female Disability
In terms of female disability, the demographic groups most similar to Swiss are Immigrants from Bosnia and Herzegovina (12.4%, a difference of 0.010%), Ute (12.4%, a difference of 0.010%), Immigrants from Thailand (12.4%, a difference of 0.030%), Mexican (12.4%, a difference of 0.050%), and Panamanian (12.4%, a difference of 0.11%).
| Demographics | Rating | Rank | Female Disability |
| Immigrants | Barbados | 21.1 /100 | #203 | Fair 12.3% |
| Immigrants | Zaire | 20.9 /100 | #204 | Fair 12.3% |
| Immigrants | Grenada | 20.5 /100 | #205 | Fair 12.4% |
| Immigrants | Cuba | 20.2 /100 | #206 | Fair 12.4% |
| Croatians | 20.2 /100 | #207 | Fair 12.4% |
| Basques | 17.5 /100 | #208 | Poor 12.4% |
| Mexicans | 15.7 /100 | #209 | Poor 12.4% |
| Swiss | 14.9 /100 | #210 | Poor 12.4% |
| Immigrants | Bosnia and Herzegovina | 14.8 /100 | #211 | Poor 12.4% |
| Ute | 14.7 /100 | #212 | Poor 12.4% |
| Immigrants | Thailand | 14.5 /100 | #213 | Poor 12.4% |
| Panamanians | 13.5 /100 | #214 | Poor 12.4% |
| Samoans | 13.4 /100 | #215 | Poor 12.4% |
| Immigrants | Burma/Myanmar | 13.3 /100 | #216 | Poor 12.4% |
| British | 12.7 /100 | #217 | Poor 12.4% |