Osage vs Immigrants from Middle Africa Seniors Poverty Over the Age of 65
COMPARE
Osage
Immigrants from Middle Africa
Seniors Poverty Over the Age of 65
Seniors Poverty Over the Age of 65 Comparison
Osage
Immigrants from Middle Africa
10.6%
SENIORS POVERTY OVER THE AGE OF 65
82.8/ 100
METRIC RATING
142nd/ 347
METRIC RANK
11.1%
SENIORS POVERTY OVER THE AGE OF 65
37.4/ 100
METRIC RATING
187th/ 347
METRIC RANK
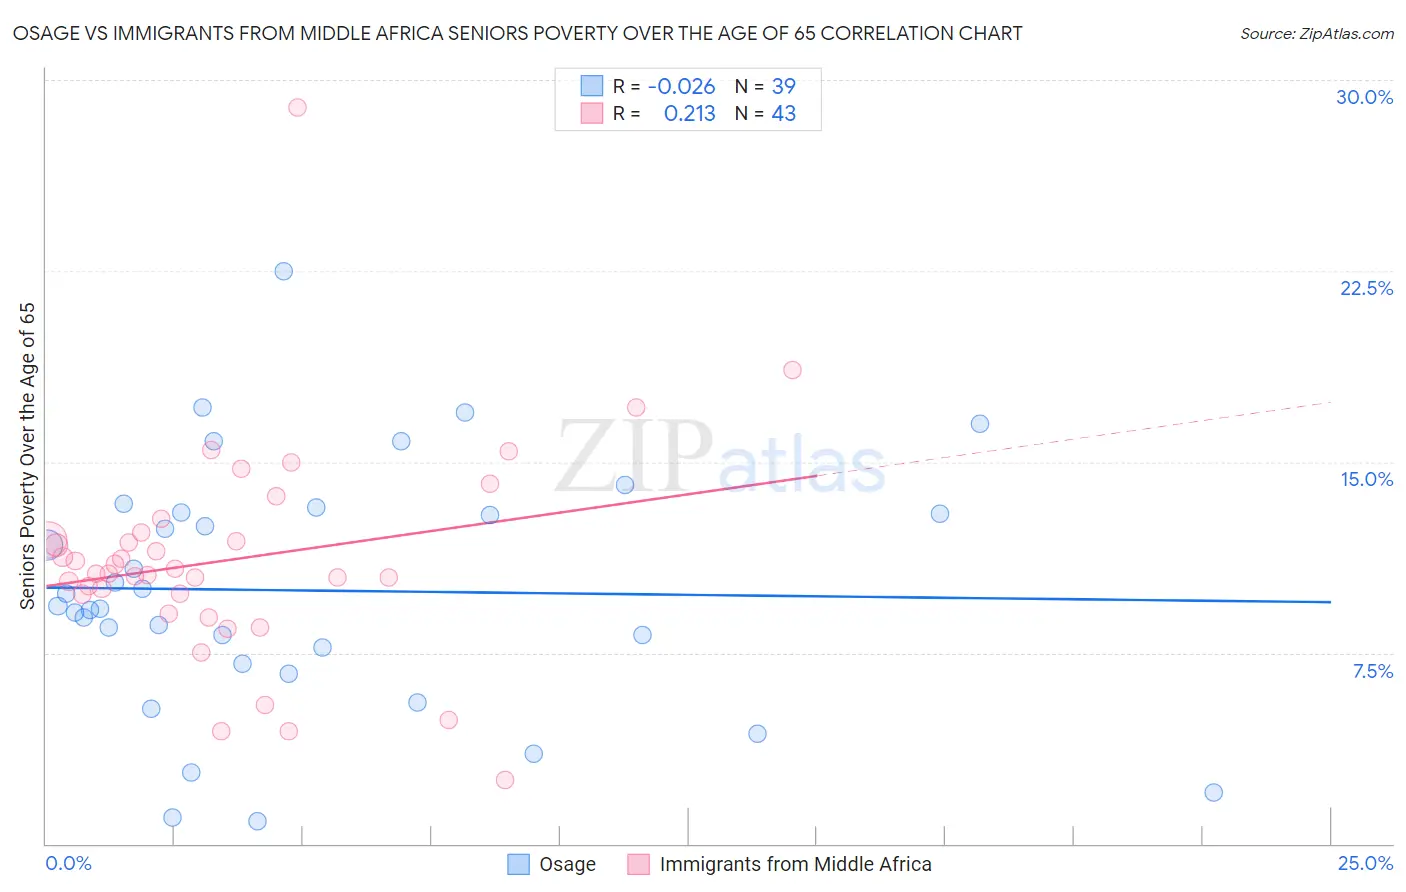
Osage vs Immigrants from Middle Africa Seniors Poverty Over the Age of 65 Correlation Chart
The statistical analysis conducted on geographies consisting of 91,738,708 people shows no correlation between the proportion of Osage and poverty level among seniors over the age of 65 in the United States with a correlation coefficient (R) of -0.026 and weighted average of 10.6%. Similarly, the statistical analysis conducted on geographies consisting of 202,261,140 people shows a weak positive correlation between the proportion of Immigrants from Middle Africa and poverty level among seniors over the age of 65 in the United States with a correlation coefficient (R) of 0.213 and weighted average of 11.1%, a difference of 4.8%.
Seniors Poverty Over the Age of 65 Correlation Summary
| Measurement | Osage | Immigrants from Middle Africa |
| Minimum | 0.89% | 2.5% |
| Maximum | 22.5% | 28.9% |
| Range | 21.6% | 26.4% |
| Mean | 9.9% | 11.2% |
| Median | 9.3% | 10.6% |
| Interquartile 25% (IQ1) | 7.1% | 9.8% |
| Interquartile 75% (IQ3) | 13.0% | 12.2% |
| Interquartile Range (IQR) | 5.9% | 2.5% |
| Standard Deviation (Sample) | 4.8% | 4.3% |
| Standard Deviation (Population) | 4.7% | 4.3% |
Similar Demographics by Seniors Poverty Over the Age of 65
Demographics Similar to Osage by Seniors Poverty Over the Age of 65
In terms of seniors poverty over the age of 65, the demographic groups most similar to Osage are Immigrants from Europe (10.5%, a difference of 0.070%), Immigrants from Kenya (10.5%, a difference of 0.090%), Portuguese (10.5%, a difference of 0.22%), Immigrants from Latvia (10.5%, a difference of 0.32%), and Immigrants from Asia (10.6%, a difference of 0.32%).
| Demographics | Rating | Rank | Seniors Poverty Over the Age of 65 |
| Immigrants | Norway | 86.5 /100 | #135 | Excellent 10.5% |
| Immigrants | Serbia | 86.4 /100 | #136 | Excellent 10.5% |
| Immigrants | Australia | 85.1 /100 | #137 | Excellent 10.5% |
| Immigrants | Latvia | 84.7 /100 | #138 | Excellent 10.5% |
| Portuguese | 84.1 /100 | #139 | Excellent 10.5% |
| Immigrants | Kenya | 83.4 /100 | #140 | Excellent 10.5% |
| Immigrants | Europe | 83.3 /100 | #141 | Excellent 10.5% |
| Osage | 82.8 /100 | #142 | Excellent 10.6% |
| Immigrants | Asia | 80.8 /100 | #143 | Excellent 10.6% |
| Iraqis | 80.7 /100 | #144 | Excellent 10.6% |
| Laotians | 79.9 /100 | #145 | Good 10.6% |
| Alaskan Athabascans | 79.1 /100 | #146 | Good 10.6% |
| Immigrants | Greece | 79.0 /100 | #147 | Good 10.6% |
| Americans | 78.1 /100 | #148 | Good 10.6% |
| Immigrants | Cameroon | 78.1 /100 | #149 | Good 10.6% |
Demographics Similar to Immigrants from Middle Africa by Seniors Poverty Over the Age of 65
In terms of seniors poverty over the age of 65, the demographic groups most similar to Immigrants from Middle Africa are Immigrants from Eastern Asia (11.1%, a difference of 0.010%), Immigrants from Lebanon (11.1%, a difference of 0.070%), Immigrants from Hong Kong (11.1%, a difference of 0.10%), Immigrants from Laos (11.1%, a difference of 0.16%), and Indian (Asian) (11.1%, a difference of 0.31%).
| Demographics | Rating | Rank | Seniors Poverty Over the Age of 65 |
| Immigrants | Thailand | 43.5 /100 | #180 | Average 11.0% |
| Immigrants | Eastern Africa | 43.4 /100 | #181 | Average 11.0% |
| Immigrants | Fiji | 42.0 /100 | #182 | Average 11.0% |
| Immigrants | Kazakhstan | 41.0 /100 | #183 | Average 11.0% |
| Immigrants | France | 40.9 /100 | #184 | Average 11.0% |
| Immigrants | Lebanon | 38.2 /100 | #185 | Fair 11.1% |
| Immigrants | Eastern Asia | 37.5 /100 | #186 | Fair 11.1% |
| Immigrants | Middle Africa | 37.4 /100 | #187 | Fair 11.1% |
| Immigrants | Hong Kong | 36.3 /100 | #188 | Fair 11.1% |
| Immigrants | Laos | 35.7 /100 | #189 | Fair 11.1% |
| Indians (Asian) | 34.2 /100 | #190 | Fair 11.1% |
| Immigrants | Uganda | 32.2 /100 | #191 | Fair 11.1% |
| Immigrants | Southern Europe | 30.1 /100 | #192 | Fair 11.1% |
| Taiwanese | 29.2 /100 | #193 | Fair 11.2% |
| Chileans | 27.8 /100 | #194 | Fair 11.2% |