Osage vs Immigrants from Scotland Female Disability
COMPARE
Osage
Immigrants from Scotland
Female Disability
Female Disability Comparison
Osage
Immigrants from Scotland
14.3%
FEMALE DISABILITY
0.0/ 100
METRIC RATING
329th/ 347
METRIC RANK
12.0%
FEMALE DISABILITY
79.3/ 100
METRIC RATING
152nd/ 347
METRIC RANK
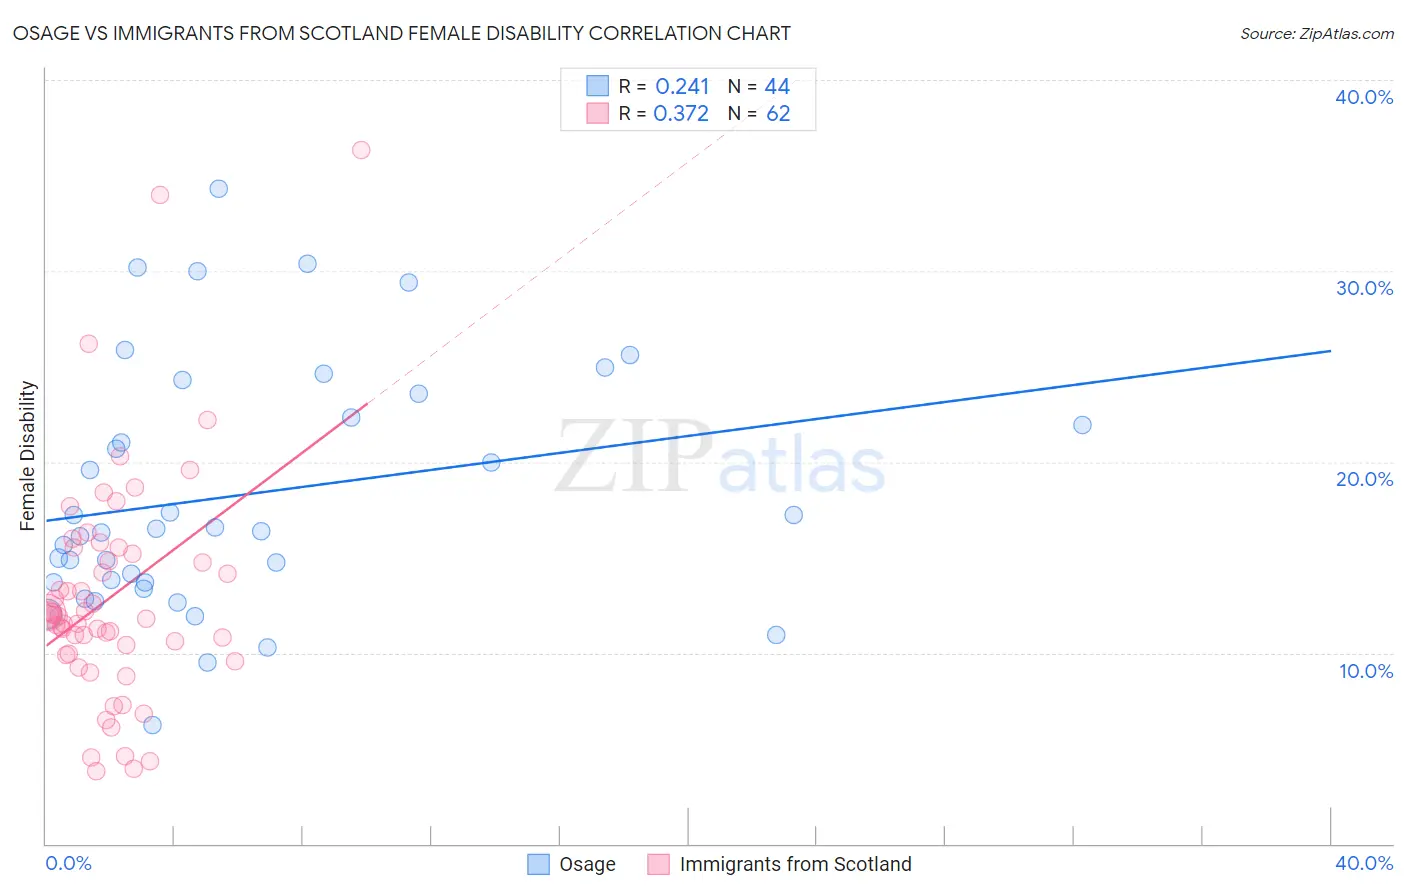
Osage vs Immigrants from Scotland Female Disability Correlation Chart
The statistical analysis conducted on geographies consisting of 91,799,541 people shows a weak positive correlation between the proportion of Osage and percentage of females with a disability in the United States with a correlation coefficient (R) of 0.241 and weighted average of 14.3%. Similarly, the statistical analysis conducted on geographies consisting of 196,394,283 people shows a mild positive correlation between the proportion of Immigrants from Scotland and percentage of females with a disability in the United States with a correlation coefficient (R) of 0.372 and weighted average of 12.0%, a difference of 18.8%.
Female Disability Correlation Summary
| Measurement | Osage | Immigrants from Scotland |
| Minimum | 6.2% | 3.8% |
| Maximum | 34.3% | 36.4% |
| Range | 28.1% | 32.6% |
| Mean | 18.3% | 12.9% |
| Median | 16.4% | 11.9% |
| Interquartile 25% (IQ1) | 13.7% | 9.9% |
| Interquartile 75% (IQ3) | 22.9% | 15.2% |
| Interquartile Range (IQR) | 9.2% | 5.3% |
| Standard Deviation (Sample) | 6.5% | 6.0% |
| Standard Deviation (Population) | 6.4% | 6.0% |
Similar Demographics by Female Disability
Demographics Similar to Osage by Female Disability
In terms of female disability, the demographic groups most similar to Osage are Ottawa (14.2%, a difference of 0.43%), Cape Verdean (14.2%, a difference of 0.43%), Comanche (14.2%, a difference of 0.87%), Navajo (14.2%, a difference of 0.98%), and Native/Alaskan (14.1%, a difference of 1.1%).
| Demographics | Rating | Rank | Female Disability |
| Pueblo | 0.0 /100 | #322 | Tragic 14.1% |
| Blacks/African Americans | 0.0 /100 | #323 | Tragic 14.1% |
| Natives/Alaskans | 0.0 /100 | #324 | Tragic 14.1% |
| Navajo | 0.0 /100 | #325 | Tragic 14.2% |
| Comanche | 0.0 /100 | #326 | Tragic 14.2% |
| Ottawa | 0.0 /100 | #327 | Tragic 14.2% |
| Cape Verdeans | 0.0 /100 | #328 | Tragic 14.2% |
| Osage | 0.0 /100 | #329 | Tragic 14.3% |
| Yuman | 0.0 /100 | #330 | Tragic 14.5% |
| Immigrants | Cabo Verde | 0.0 /100 | #331 | Tragic 14.6% |
| Pima | 0.0 /100 | #332 | Tragic 14.8% |
| Immigrants | Azores | 0.0 /100 | #333 | Tragic 14.9% |
| Cherokee | 0.0 /100 | #334 | Tragic 14.9% |
| Cajuns | 0.0 /100 | #335 | Tragic 14.9% |
| Seminole | 0.0 /100 | #336 | Tragic 15.0% |
Demographics Similar to Immigrants from Scotland by Female Disability
In terms of female disability, the demographic groups most similar to Immigrants from Scotland are Sudanese (12.0%, a difference of 0.010%), Icelander (12.0%, a difference of 0.090%), Immigrants from Moldova (12.0%, a difference of 0.13%), Syrian (12.1%, a difference of 0.13%), and Ghanaian (12.1%, a difference of 0.15%).
| Demographics | Rating | Rank | Female Disability |
| Estonians | 87.8 /100 | #145 | Excellent 12.0% |
| Pakistanis | 84.6 /100 | #146 | Excellent 12.0% |
| Nigerians | 84.0 /100 | #147 | Excellent 12.0% |
| Immigrants | Kenya | 83.1 /100 | #148 | Excellent 12.0% |
| Greeks | 82.0 /100 | #149 | Excellent 12.0% |
| Immigrants | Moldova | 81.4 /100 | #150 | Excellent 12.0% |
| Icelanders | 80.7 /100 | #151 | Excellent 12.0% |
| Immigrants | Scotland | 79.3 /100 | #152 | Good 12.0% |
| Sudanese | 79.1 /100 | #153 | Good 12.0% |
| Syrians | 76.9 /100 | #154 | Good 12.1% |
| Ghanaians | 76.6 /100 | #155 | Good 12.1% |
| Moroccans | 72.9 /100 | #156 | Good 12.1% |
| Danes | 72.5 /100 | #157 | Good 12.1% |
| Immigrants | Middle Africa | 72.4 /100 | #158 | Good 12.1% |
| Immigrants | Central America | 67.7 /100 | #159 | Good 12.1% |