Osage vs Immigrants from Congo Female Disability
COMPARE
Osage
Immigrants from Congo
Female Disability
Female Disability Comparison
Osage
Immigrants from Congo
14.3%
FEMALE DISABILITY
0.0/ 100
METRIC RATING
329th/ 347
METRIC RANK
12.7%
FEMALE DISABILITY
1.8/ 100
METRIC RATING
249th/ 347
METRIC RANK
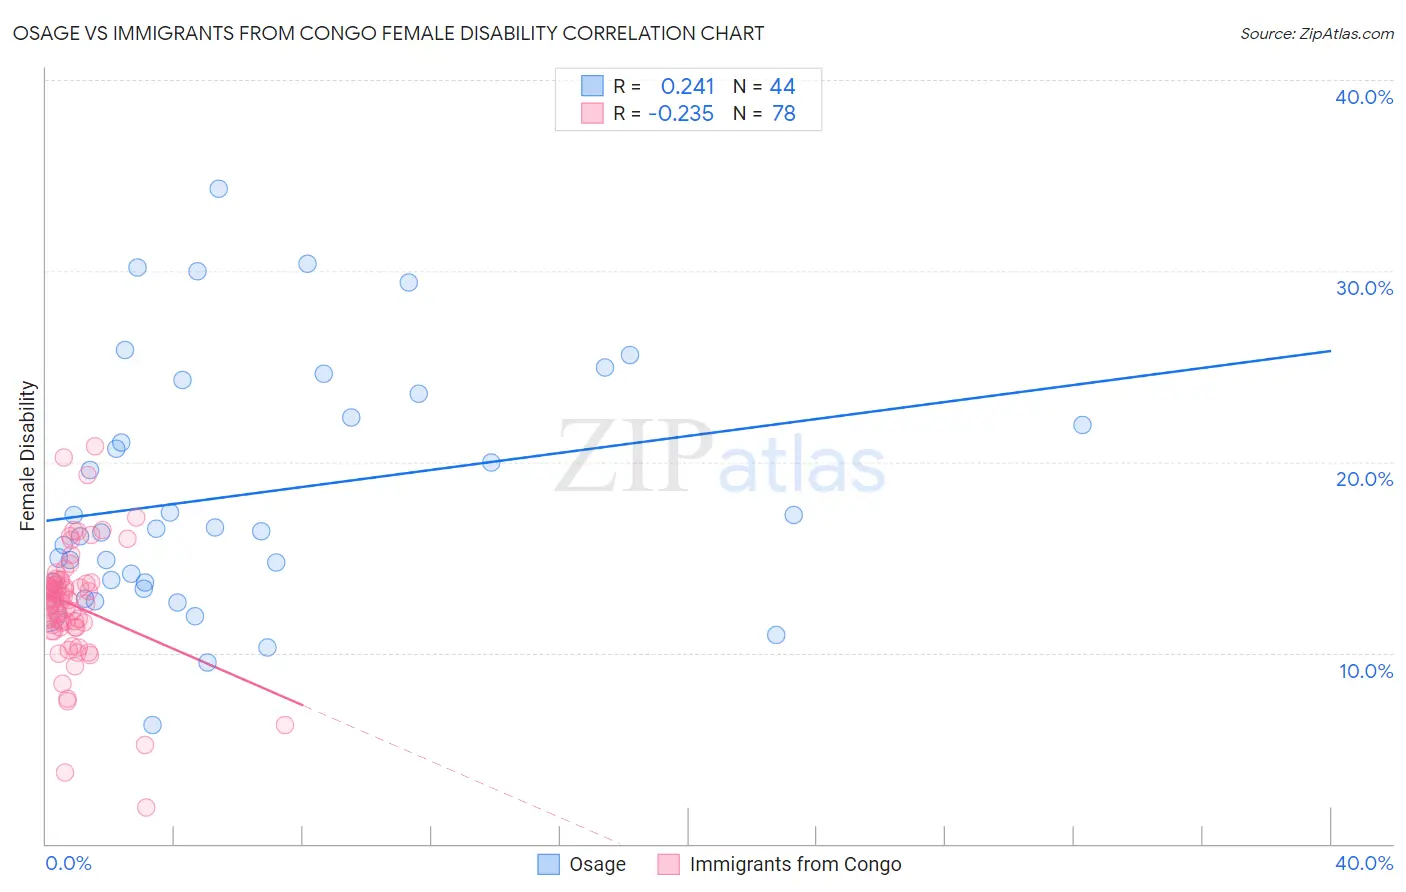
Osage vs Immigrants from Congo Female Disability Correlation Chart
The statistical analysis conducted on geographies consisting of 91,799,541 people shows a weak positive correlation between the proportion of Osage and percentage of females with a disability in the United States with a correlation coefficient (R) of 0.241 and weighted average of 14.3%. Similarly, the statistical analysis conducted on geographies consisting of 92,114,824 people shows a weak negative correlation between the proportion of Immigrants from Congo and percentage of females with a disability in the United States with a correlation coefficient (R) of -0.235 and weighted average of 12.7%, a difference of 13.0%.
Female Disability Correlation Summary
| Measurement | Osage | Immigrants from Congo |
| Minimum | 6.2% | 1.9% |
| Maximum | 34.3% | 20.8% |
| Range | 28.1% | 19.0% |
| Mean | 18.3% | 12.5% |
| Median | 16.4% | 12.8% |
| Interquartile 25% (IQ1) | 13.7% | 11.4% |
| Interquartile 75% (IQ3) | 22.9% | 13.7% |
| Interquartile Range (IQR) | 9.2% | 2.3% |
| Standard Deviation (Sample) | 6.5% | 3.1% |
| Standard Deviation (Population) | 6.4% | 3.1% |
Similar Demographics by Female Disability
Demographics Similar to Osage by Female Disability
In terms of female disability, the demographic groups most similar to Osage are Ottawa (14.2%, a difference of 0.43%), Cape Verdean (14.2%, a difference of 0.43%), Comanche (14.2%, a difference of 0.87%), Navajo (14.2%, a difference of 0.98%), and Native/Alaskan (14.1%, a difference of 1.1%).
| Demographics | Rating | Rank | Female Disability |
| Pueblo | 0.0 /100 | #322 | Tragic 14.1% |
| Blacks/African Americans | 0.0 /100 | #323 | Tragic 14.1% |
| Natives/Alaskans | 0.0 /100 | #324 | Tragic 14.1% |
| Navajo | 0.0 /100 | #325 | Tragic 14.2% |
| Comanche | 0.0 /100 | #326 | Tragic 14.2% |
| Ottawa | 0.0 /100 | #327 | Tragic 14.2% |
| Cape Verdeans | 0.0 /100 | #328 | Tragic 14.2% |
| Osage | 0.0 /100 | #329 | Tragic 14.3% |
| Yuman | 0.0 /100 | #330 | Tragic 14.5% |
| Immigrants | Cabo Verde | 0.0 /100 | #331 | Tragic 14.6% |
| Pima | 0.0 /100 | #332 | Tragic 14.8% |
| Immigrants | Azores | 0.0 /100 | #333 | Tragic 14.9% |
| Cherokee | 0.0 /100 | #334 | Tragic 14.9% |
| Cajuns | 0.0 /100 | #335 | Tragic 14.9% |
| Seminole | 0.0 /100 | #336 | Tragic 15.0% |
Demographics Similar to Immigrants from Congo by Female Disability
In terms of female disability, the demographic groups most similar to Immigrants from Congo are Slovene (12.7%, a difference of 0.040%), Crow (12.7%, a difference of 0.10%), Carpatho Rusyn (12.6%, a difference of 0.13%), Menominee (12.6%, a difference of 0.16%), and Spanish American Indian (12.6%, a difference of 0.18%).
| Demographics | Rating | Rank | Female Disability |
| Canadians | 2.6 /100 | #242 | Tragic 12.6% |
| Immigrants | Senegal | 2.5 /100 | #243 | Tragic 12.6% |
| Alsatians | 2.5 /100 | #244 | Tragic 12.6% |
| Immigrants | Jamaica | 2.2 /100 | #245 | Tragic 12.6% |
| Spanish American Indians | 2.1 /100 | #246 | Tragic 12.6% |
| Menominee | 2.1 /100 | #247 | Tragic 12.6% |
| Carpatho Rusyns | 2.0 /100 | #248 | Tragic 12.6% |
| Immigrants | Congo | 1.8 /100 | #249 | Tragic 12.7% |
| Slovenes | 1.7 /100 | #250 | Tragic 12.7% |
| Crow | 1.6 /100 | #251 | Tragic 12.7% |
| Immigrants | Caribbean | 1.4 /100 | #252 | Tragic 12.7% |
| Jamaicans | 1.4 /100 | #253 | Tragic 12.7% |
| Hawaiians | 1.4 /100 | #254 | Tragic 12.7% |
| Immigrants | Germany | 1.3 /100 | #255 | Tragic 12.7% |
| British West Indians | 1.2 /100 | #256 | Tragic 12.7% |