European vs Immigrants from Middle Africa Female Disability
COMPARE
European
Immigrants from Middle Africa
Female Disability
Female Disability Comparison
Europeans
Immigrants from Middle Africa
12.4%
FEMALE DISABILITY
12.1/ 100
METRIC RATING
219th/ 347
METRIC RANK
12.1%
FEMALE DISABILITY
72.4/ 100
METRIC RATING
158th/ 347
METRIC RANK
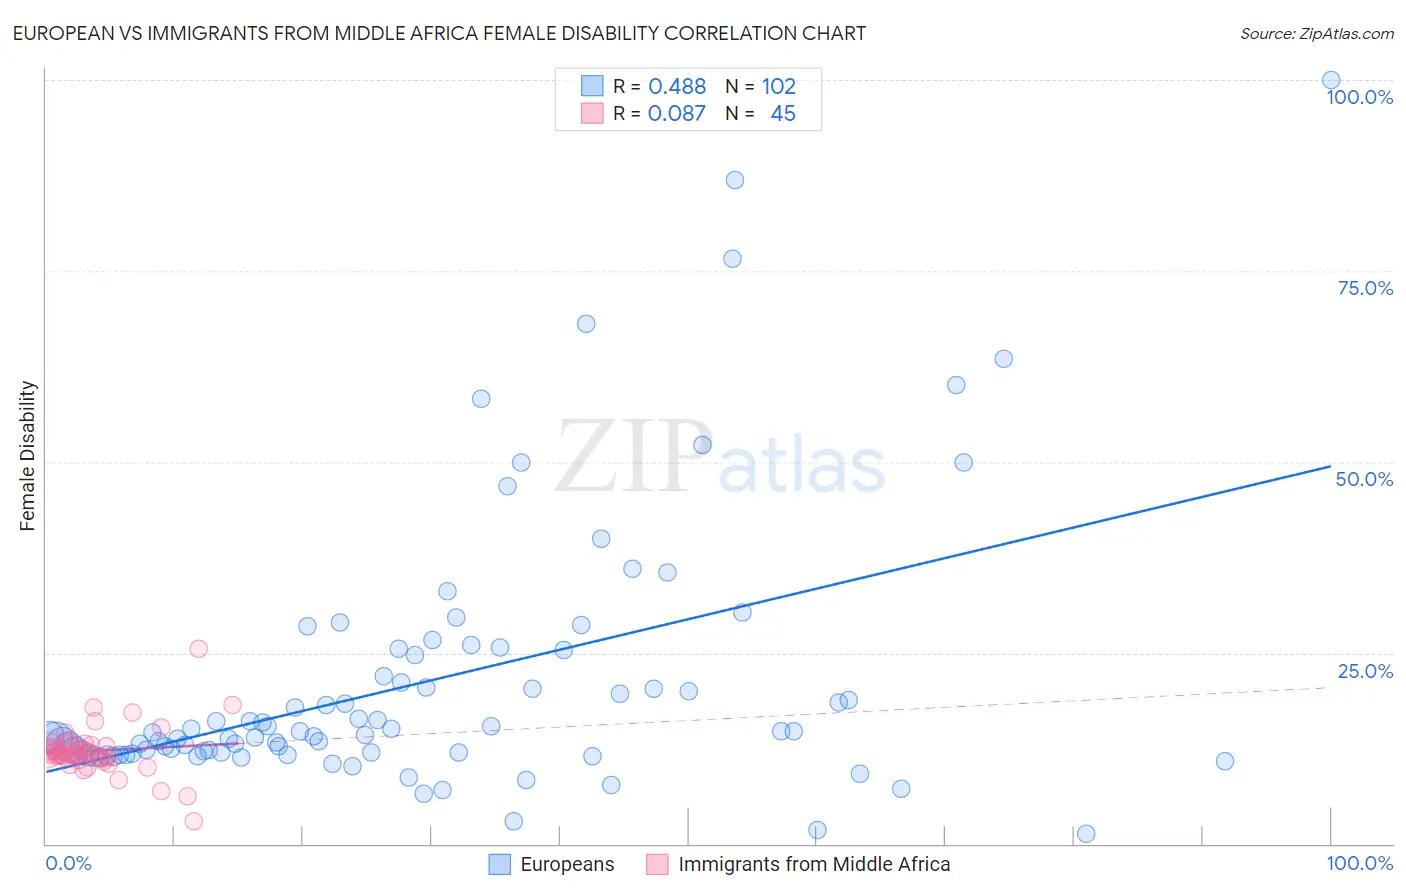
European vs Immigrants from Middle Africa Female Disability Correlation Chart
The statistical analysis conducted on geographies consisting of 561,578,477 people shows a moderate positive correlation between the proportion of Europeans and percentage of females with a disability in the United States with a correlation coefficient (R) of 0.488 and weighted average of 12.4%. Similarly, the statistical analysis conducted on geographies consisting of 202,716,278 people shows a slight positive correlation between the proportion of Immigrants from Middle Africa and percentage of females with a disability in the United States with a correlation coefficient (R) of 0.087 and weighted average of 12.1%, a difference of 2.8%.
Female Disability Correlation Summary
| Measurement | European | Immigrants from Middle Africa |
| Minimum | 1.3% | 2.9% |
| Maximum | 100.0% | 25.5% |
| Range | 98.8% | 22.6% |
| Mean | 21.2% | 12.2% |
| Median | 14.4% | 11.9% |
| Interquartile 25% (IQ1) | 11.9% | 11.1% |
| Interquartile 75% (IQ3) | 24.8% | 12.8% |
| Interquartile Range (IQR) | 12.9% | 1.7% |
| Standard Deviation (Sample) | 17.6% | 3.4% |
| Standard Deviation (Population) | 17.5% | 3.3% |
Similar Demographics by Female Disability
Demographics Similar to Europeans by Female Disability
In terms of female disability, the demographic groups most similar to Europeans are Immigrants from Bahamas (12.4%, a difference of 0.030%), British (12.4%, a difference of 0.050%), Bahamian (12.4%, a difference of 0.090%), Immigrants from Burma/Myanmar (12.4%, a difference of 0.10%), and Panamanian (12.4%, a difference of 0.11%).
| Demographics | Rating | Rank | Female Disability |
| Ute | 14.7 /100 | #212 | Poor 12.4% |
| Immigrants | Thailand | 14.5 /100 | #213 | Poor 12.4% |
| Panamanians | 13.5 /100 | #214 | Poor 12.4% |
| Samoans | 13.4 /100 | #215 | Poor 12.4% |
| Immigrants | Burma/Myanmar | 13.3 /100 | #216 | Poor 12.4% |
| British | 12.7 /100 | #217 | Poor 12.4% |
| Immigrants | Bahamas | 12.5 /100 | #218 | Poor 12.4% |
| Europeans | 12.1 /100 | #219 | Poor 12.4% |
| Bahamians | 11.1 /100 | #220 | Poor 12.4% |
| Native Hawaiians | 10.8 /100 | #221 | Poor 12.4% |
| Italians | 10.7 /100 | #222 | Poor 12.4% |
| Guamanians/Chamorros | 9.5 /100 | #223 | Tragic 12.5% |
| Belizeans | 9.3 /100 | #224 | Tragic 12.5% |
| Poles | 8.4 /100 | #225 | Tragic 12.5% |
| Hispanics or Latinos | 8.0 /100 | #226 | Tragic 12.5% |
Demographics Similar to Immigrants from Middle Africa by Female Disability
In terms of female disability, the demographic groups most similar to Immigrants from Middle Africa are Danish (12.1%, a difference of 0.010%), Moroccan (12.1%, a difference of 0.020%), Ghanaian (12.1%, a difference of 0.21%), Immigrants from Central America (12.1%, a difference of 0.21%), and Syrian (12.1%, a difference of 0.23%).
| Demographics | Rating | Rank | Female Disability |
| Icelanders | 80.7 /100 | #151 | Excellent 12.0% |
| Immigrants | Scotland | 79.3 /100 | #152 | Good 12.0% |
| Sudanese | 79.1 /100 | #153 | Good 12.0% |
| Syrians | 76.9 /100 | #154 | Good 12.1% |
| Ghanaians | 76.6 /100 | #155 | Good 12.1% |
| Moroccans | 72.9 /100 | #156 | Good 12.1% |
| Danes | 72.5 /100 | #157 | Good 12.1% |
| Immigrants | Middle Africa | 72.4 /100 | #158 | Good 12.1% |
| Immigrants | Central America | 67.7 /100 | #159 | Good 12.1% |
| Immigrants | Guatemala | 66.0 /100 | #160 | Good 12.1% |
| Guyanese | 64.7 /100 | #161 | Good 12.1% |
| Immigrants | Ukraine | 64.3 /100 | #162 | Good 12.1% |
| Guatemalans | 63.8 /100 | #163 | Good 12.1% |
| Czechs | 63.6 /100 | #164 | Good 12.1% |
| Immigrants | Oceania | 61.8 /100 | #165 | Good 12.1% |