Osage vs Immigrants from Chile Disability Age 5 to 17
COMPARE
Osage
Immigrants from Chile
Disability Age 5 to 17
Disability Age 5 to 17 Comparison
Osage
Immigrants from Chile
6.5%
DISABILITY AGE 5 TO 17
0.0/ 100
METRIC RATING
323rd/ 347
METRIC RANK
5.4%
DISABILITY AGE 5 TO 17
95.0/ 100
METRIC RATING
125th/ 347
METRIC RANK
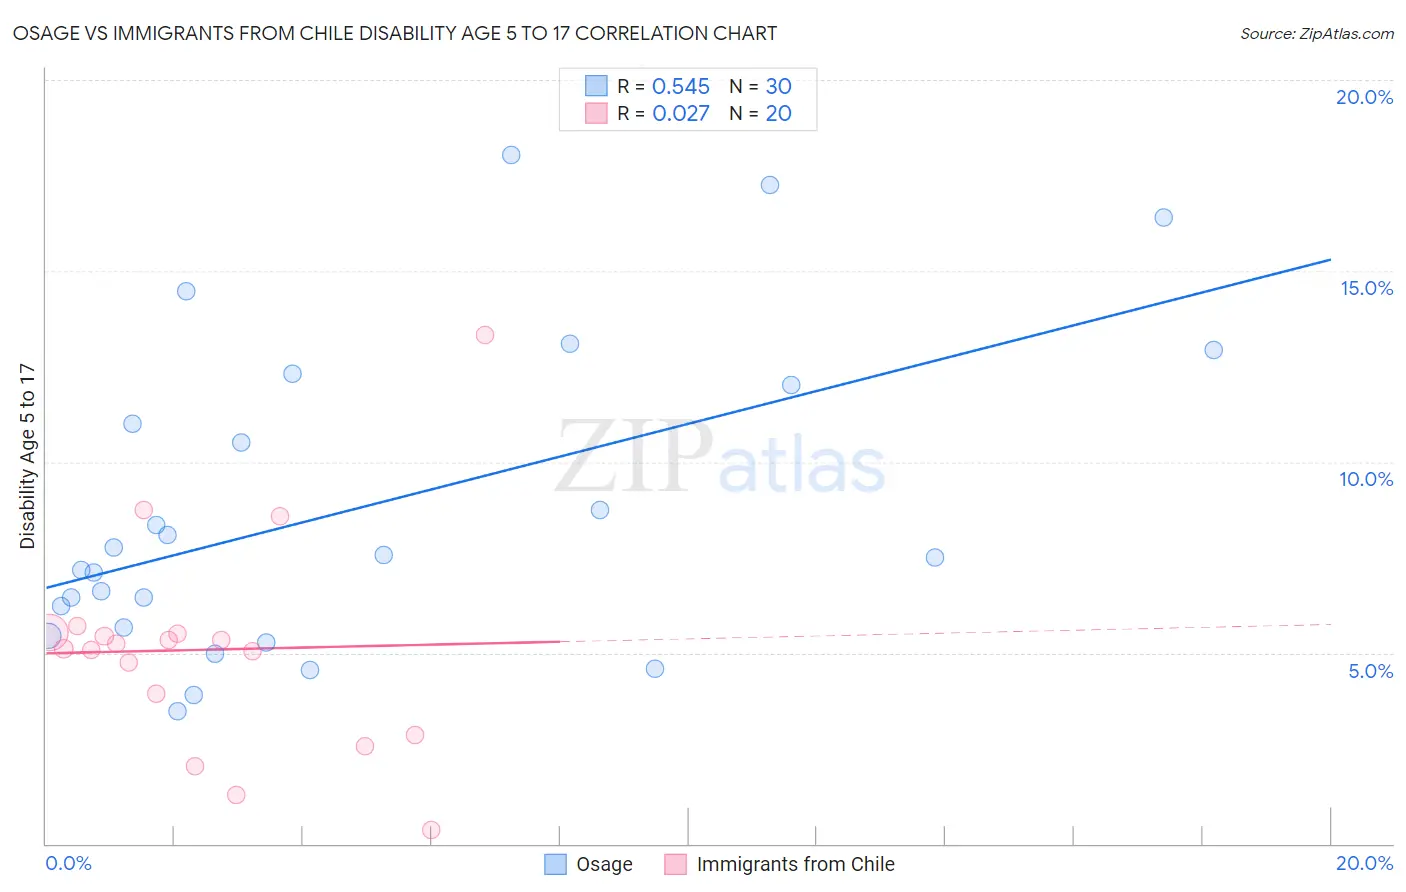
Osage vs Immigrants from Chile Disability Age 5 to 17 Correlation Chart
The statistical analysis conducted on geographies consisting of 91,613,344 people shows a substantial positive correlation between the proportion of Osage and percentage of population with a disability between the ages 5 and 17 in the United States with a correlation coefficient (R) of 0.545 and weighted average of 6.5%. Similarly, the statistical analysis conducted on geographies consisting of 217,781,559 people shows no correlation between the proportion of Immigrants from Chile and percentage of population with a disability between the ages 5 and 17 in the United States with a correlation coefficient (R) of 0.027 and weighted average of 5.4%, a difference of 20.8%.
Disability Age 5 to 17 Correlation Summary
| Measurement | Osage | Immigrants from Chile |
| Minimum | 3.5% | 0.37% |
| Maximum | 18.0% | 13.3% |
| Range | 14.5% | 13.0% |
| Mean | 8.8% | 5.1% |
| Median | 7.5% | 5.2% |
| Interquartile 25% (IQ1) | 5.7% | 3.4% |
| Interquartile 75% (IQ3) | 12.0% | 5.5% |
| Interquartile Range (IQR) | 6.4% | 2.1% |
| Standard Deviation (Sample) | 4.1% | 2.8% |
| Standard Deviation (Population) | 4.0% | 2.8% |
Similar Demographics by Disability Age 5 to 17
Demographics Similar to Osage by Disability Age 5 to 17
In terms of disability age 5 to 17, the demographic groups most similar to Osage are Slovak (6.5%, a difference of 0.040%), Tohono O'odham (6.5%, a difference of 0.060%), Dominican (6.5%, a difference of 0.080%), American (6.5%, a difference of 0.14%), and Potawatomi (6.5%, a difference of 0.27%).
| Demographics | Rating | Rank | Disability Age 5 to 17 |
| Immigrants | Dominican Republic | 0.0 /100 | #316 | Tragic 6.4% |
| Kiowa | 0.0 /100 | #317 | Tragic 6.4% |
| Comanche | 0.0 /100 | #318 | Tragic 6.4% |
| Delaware | 0.0 /100 | #319 | Tragic 6.5% |
| Africans | 0.0 /100 | #320 | Tragic 6.5% |
| Tohono O'odham | 0.0 /100 | #321 | Tragic 6.5% |
| Slovaks | 0.0 /100 | #322 | Tragic 6.5% |
| Osage | 0.0 /100 | #323 | Tragic 6.5% |
| Dominicans | 0.0 /100 | #324 | Tragic 6.5% |
| Americans | 0.0 /100 | #325 | Tragic 6.5% |
| Potawatomi | 0.0 /100 | #326 | Tragic 6.5% |
| French American Indians | 0.0 /100 | #327 | Tragic 6.6% |
| Pennsylvania Germans | 0.0 /100 | #328 | Tragic 6.6% |
| Blackfeet | 0.0 /100 | #329 | Tragic 6.6% |
| Dutch West Indians | 0.0 /100 | #330 | Tragic 6.7% |
Demographics Similar to Immigrants from Chile by Disability Age 5 to 17
In terms of disability age 5 to 17, the demographic groups most similar to Immigrants from Chile are Crow (5.4%, a difference of 0.010%), New Zealander (5.4%, a difference of 0.010%), Latvian (5.4%, a difference of 0.010%), Immigrants from Venezuela (5.4%, a difference of 0.13%), and Immigrants from Ethiopia (5.4%, a difference of 0.15%).
| Demographics | Rating | Rank | Disability Age 5 to 17 |
| South Americans | 97.1 /100 | #118 | Exceptional 5.4% |
| Immigrants | South America | 97.1 /100 | #119 | Exceptional 5.4% |
| Immigrants | Immigrants | 97.0 /100 | #120 | Exceptional 5.4% |
| Maltese | 96.0 /100 | #121 | Exceptional 5.4% |
| Chileans | 95.8 /100 | #122 | Exceptional 5.4% |
| Immigrants | Ethiopia | 95.5 /100 | #123 | Exceptional 5.4% |
| Crow | 95.0 /100 | #124 | Exceptional 5.4% |
| Immigrants | Chile | 95.0 /100 | #125 | Exceptional 5.4% |
| New Zealanders | 95.0 /100 | #126 | Exceptional 5.4% |
| Latvians | 95.0 /100 | #127 | Exceptional 5.4% |
| Immigrants | Venezuela | 94.5 /100 | #128 | Exceptional 5.4% |
| Romanians | 94.1 /100 | #129 | Exceptional 5.4% |
| Immigrants | Bulgaria | 94.0 /100 | #130 | Exceptional 5.4% |
| Arabs | 92.9 /100 | #131 | Exceptional 5.4% |
| Immigrants | Colombia | 92.9 /100 | #132 | Exceptional 5.4% |